ISSN: 1204-5357
ISSN: 1204-5357
ILKER MET
Ziraat Bank, Ankara, Turkey
AYFER ERKOÇ
Ziraat Bank, Ankara, Turkey
ERTUGRUL UMUT UYSAL
Ziraat Bank, Ankara, Turkey
Visit for more related articles at Journal of Internet Banking and Commerce
Research has showed that employee feedbacks are a useful way to obtain and utilize employees’ creative ideas. To be effective, employees must be motivated to think creatively and express opinions. Nowadays user behaviors are shaping the needs of change to a large extent. Ãâðt is beneficial to provide satisfaction of employees who play a bridge role with external customers for businesses. Businesses that take this innovation into account can gain various utilities. One of the most well-known utility is to make users feel valuable; reduce the duration of learning and acceptance of work. Ãâðn this paper, it will be explained how the employees’ opinions are analyzed and how the new business processes are redesigned with a new innovative way. User experience analyses offer that: “don’t be afraid of digital technologies; just start from a simple solution that will enrich your customer experiences and match their needs. Iterate and move forward step-by-step by implementing new solutions”. This study aims to measure the user experience satisfaction level in Ziraat Bank for interface of core banking software. Ãâðt is examines the 11 factors of customer experience and identifies their impact on customer satisfaction. Data were collected from 376 users. Wilcoxon signed-rank, paired t tests are applied to identify the relationship between 11 experience factors and demographics of respondents. By this reliable and valid scale, bank managers can identify the current and expected experiences of the customers/employees and can build up effective strategies for the utmost satisfaction of the customers/employees.
Innovation; Innovation in Banking Services; User Feedback; User Experience Design
The changing technologies bring with them the necessity of the changes in products or services. That is not all. Today, user behaviors are shaping the needs of change to a great extent. Therefore, the necessity of user-focused changes is the priority. Product-related user experience studies provide specific evidence to businesses that will increase customer satisfaction. So businesses need to develop and use their analytical skills more than ever. It is also important to combine the data analysis capabilities within business disciplines and strategies in this occasion. Businesses that “being able to translate empathy from the user into a system” can be successful. Figure out the right approaches and metrics, businesses should test continually until determine what works. Both quantitative skills and understanding of the customer are critical. Without a clear idea of a customer’ goals and motivations throughout the customer journey, all the numbers are meaningless [1]. Not only statistics, algorithms and mathematical significance are important but also combine them with experience is also important.
Businesses that want to make long-term improvements should use the analysis of customer behavior at the base of their business processes. User experience (UX) testing focuses on having a deep understanding of what the users need, what their value, abilities and also their limitations are. It also takes into account the business vision and goals of the group which is managing the project. UX best practices promote improving the quality of the users’ interaction and perceptions with product and related services [2]. The financial sector should also make experience innovation part of their business processes rather than relying on assumptions and intuitions. Analyzing users’ experience becomes a much more effective tool for businesses.
UX is a core competency that needs to be developed for sustainable customer satisfaction and to create long-term value perception. By monitoring customer behaviors, user experiences can be incorporated into business processes. The user experience includes behaviors such as emotions, preferences, etc. that users experienced to reach specific goals on the product/service being designed. User researches are located at the core of user experience studies. It is really important to make studies covering all business processes for understanding user needs, behaviors and expectations. At this stage, determining individuals (persona) who use the product or service, detecting the causes of development and revealing needs are facilitated in the design phase. During design and after the design, user experience tests are conducted for checking design and taking user’s opinions [3]. A good user experience study includes the steps of 'Observing Events and Responses’, 'Analyzing the Data', 'Making Decisions to Next Steps'. Incorporating user opinions at every stage of the project is the nature of UX's work [4].
Today, it is even more important for businesses to gain the ability to effectively listen and analyze the feedback received. For companies, products and services need to be constantly renewed because of changing technologies. The availability of designed products and services is directly related to both the costs and the image of the business. The main purpose of user testing is to understand or measure people's behavior. Well-structured and verified surveys are an efficient and inexpensive method for making these measurements [5].
A number of methods can be developed to reveal user needs, requests and feelings; such as applying focus group interviews, online tests, surveys, customer feedbacks from site visitors, usability tests, A/B tests, thermal maps, eye tracking, focus interviews, post-design tests, etc. to convey information directly to the design process [6].
Establishing the designed products and services in line with the end user views allows the design to be accepted quickly. İn this stage, it should not be forgotten that the most important participant of the stakeholders is the end user. 89 percent of businesses think that design of user experience is the most important instrument for “loyalty” but businesses may not very willing to incorporate user opinions into their business processes [7]. The reasons for businesses being reluctant to adapt user-centered design activities to software development processes are user-centric designs require time and cost, cultural prejudices and lack of a framework to guide the software development team [8]. Many companies are still insisting on tightening their design budgets. User experience designers assume that they will predict all kinds of user behaviors and may prefer not to do enough tests [9]. Despite these facts, some businesses compose laboratories that also support mobile channels for user experience testing. With these tests, designers can capture the gestures and mimics of the users’ interaction with the product so that they can observe where and how much trouble they are experiencing or what steps they enjoy. Besides, organizations that care about the user experience are going to specialize in the user experience team. In some institutions, it may be emphasized that specialists in the role of interaction designer try to analyze the psychology of the users during their work on the persona and to take their feelings and thoughts with certain approaches [2].
There are many effective examples of user experience processes in the e-commerce, media and IT sectors. Many leading companies such as Microsoft, Amazon, Booking.com, Facebook, and Google are conducting more than ten thousand online controlled experiments annually, with many tests involving millions of users. Startups and non-digital entrepreneurs like Walmart, Hertz, and Singapore Airlines also regularly have conducted these researches. These institutions have realized that the approach of "experimenting with every issue" has surprisingly big gains. Bing, the search engine that incorporates user experiment results into business processes has come to realize that its revenue increased from 10% to 25% each year. In addition to the changes that increase user satisfaction, the main reason why Bing is profitable and the share of calls made from personal computers in the US up to 23% in 2009, when it started to give importance to user experience in 2009. At the same time that the web is vital for nearly all businesses, elaboration of online experiments should be part of standard operating procedures. Controlled experiments can turn decision-making from an instinctual reaction into a rather scientific, proof-based process. Without these experiments, many groundbreaking innovations could never have appeared, or many bad ideas could only be passed on to failure and wasted resources [10].
The prepared online questionnaire was sent to 1.007 individuals selected by random sampling methods. The opinions of 376 users who answered all questions were taken into account. İn order to avoid bias of user skills, the opinions of users working in all branches of the bank has been included in the survey in accordance with proportion of branches. This selection of respondents is part of our mechanism to guarantee the validity of our research.
It is important that the sample represents the universe from which the sample was taken. In this case, the question of how much, and how large a sample can represent the universe, arises. Sampling error occurs when there is no representative authority in the universe [11]. A sufficient sample is a sample that contains enough elements to provide reliable results. The number of people to be surveyed was determined by using statistical sampling methods. The front-panel display uses 10.000 people. All users perform the same operations with the same authorization. All users have been using the screen for at least 1 year.
When the number of universe units is over 10000, the above formula is applied as follows [11].
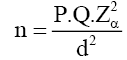
P=0.05
Q=0.05
Zα: α=0.05=1.96
n is calculated as 266.
So, the number of people surveyed (376) is representative of the sample.
Demographic Features
Analysis is started by examining the demographic information of participants. İn the survey 45% of 376 participants are male, 55% are females. When the educational status is examined, it is seen that 18% is high school graduate, 78% is bachelor degree graduate and 4% is master degree graduate. When the participants are analyzed according to the age distribution, it is determined that 1% of the participants are younger than 36, 45% are in the age range of 37-41, 45% are in the age range of 42-46 and 9% are older than 47 years. The number of branches based on province (%) and the number of participants on provinces (%) are also examined.
Experiment Procedures
We asked respondents to do some tasks as part of usability testing and post-experiment survey. The following describes how we set our experiments.
The number of users is determined by random sampling method.
At first users are required to complete a simple scenario to make a transaction from the relevant interface of core banking system.
Next respondents had to complete the pre-experiment survey regarding their experiences after transaction.
The respondents were asked to give ratings on the design with the following aspects: functionality, learnability, usability, intuitive, efficiency. We have developed 11-item online questionnaire on 1 to 5 points to measure these aspects.
According to the feedback from the users, the data was analyzed and the interface of the core banking was redesigned. (In the design phase heat maps, focus groups, click tests and A/B tests have been used. The purpose of this work show how the sensitivity of the user changes before and after design in this study. For that reason, the analysis of the tests made before and after is shared in this paper).
After redesigned, same respondents were asked to give ratings to the same questionnaire. The complete questionnaire can be found in the Appendix.
The duration performances of the old and new designs are used as an indicator. The old design does not include user experience.
Hypotheses Development
By considering the purpose and benefit of the user experience design we posit the following hypotheses:
H1: There is a significant difference of placement of buttons between two designs.
H2: There is a significant difference of number of buttons between two designs.
H3: There is a significant difference of suitability of panels between two designs
H4: There is a significant difference of simplicity of user interface panels between two designs.
H5: There is a significant difference of related screen accessibility between two designs.
H6: There is a significant difference of speed between two designs.
H7: There is significant difference of clarity of guiding messages between two designs.
H8: There is a significant difference of clarity of user interface panels between two designs.
H9: There is a significant difference of ease of between two designs.
H10: There is a significant difference of single screen ease of operation between two designs. (The transaction was completed by a journey between different screens but at the new design only one screen is enough to complete the transaction.)
H11: There is a significant difference of no extra tool needed to complete the transaction between two designs.
The purpose of the research is to ensure that the newly designed core banking system is renewed/designed in accordance with user opinions. After that, satisfaction level is measured between two designs.
Reliability, Validity and Normality Test
İnstruments for survey are validated by using reliability and validity test. An item is considered valid if corrected item-total correlation score is greater than r-table score [12,13]. İn this research is 0,234 with a significant level of 0.05, value of df is 375, and value of t was 1,975. Corrected item-total correlation scores from first to last questionnaire item is 0.740, 0.735, 0.728, 0.770, 0.572, 0.551, 0.631, 0.623, 0.763, 0.622, 0.710 which mean that all items are valid.
In order to measure the reliability of each variable, Cronbach’s Alpha value is used. A variable is said to be reliable when its Cronbach’s Alpha value is equal or greater than 0.70 [12]. Cronbach’s Alpha for functionality, learnability, usability, intuitive, efficiency is 0.792, 0.721, 0.809, 0.778 and 0.783 respectively. Thus all variables are reliable.
Normality test is also done before conducting hypotheses test. The normality of data can be seen by using skewness and kurtosis for each variable. The data is considered to be normal if abs (skewness) ≤ 1, and abs (kurtosis) ≤ 1 [13]. If the data is not normal, outliers can be removed. Data is considered as an outlier if its Z-score is not in the range of -3.0 to 3.0. If outlier removal does not improve the normality, data can be transformed or non-parametric tests can be used [13].
As shown in Table 2, except for no extra tool needed while transaction, variables are distributed normally. The variable transformed by using log transformation, still the variable is not normally distributed. At this stage, the outlier can be removed or non-parametric methods can be used.
Table 1: Demographic features.
| Gender | Frequency | % | Province | Bank Branches % | Participant % |
|---|---|---|---|---|---|
| Male | 205 | 55% | Istanbul | 15.81% | 18.62% |
| Female | 171 | 45% | Izmir | 8.36% | 8.24% |
| Education | Frequency | % | Ankara | 5.29% | 7.98% |
| High School | 68 | 18% | Antalya | 2.96% | 3.46% |
| Bachelor Degree | 293 | 78% | Balikesir | 2.79% | 3.19% |
| Master Degree | 15 | 4% | Bursa | 1.59% | 3.19% |
| Age | Frequency | % | Denizli | 1.59% | 3.19% |
| <=36 | 5 | 1% | Eskisehir | 1.37% | 2.93% |
| 37-41 | 168 | 45% | Kastamonu | 1.19% | 2.66% |
| 42-46 | 168 | 45% | Manisa | 0.91% | 2.13% |
| >=47 | 35 | 9% | Other Provinces | 58.13% | 44.41% |
Table 2: Result of Normality test.
| Variable | Skewness | Kurtosis |
|---|---|---|
| Placement of buttons | -0.409 | -0.928 |
| Number of buttons | -0.482 | -0.585 |
| Suitability of user interface panels | -0.516 | -0.612 |
| Simplicity of user interface panels | -0.363 | -0.874 |
| Related screen accessibility | -0.707 | 0.147 |
| Speed | -0.533 | -0.808 |
| Clarity of guiding messages | -0.76 | 0.382 |
| Clarity of user interface panels | -0.519 | -0.777 |
| Ease of use | -0.418 | -0.673 |
| Single screen ease of operation | -0.873 | 0.79 |
| No extra tool needed to complete transaction | -1,157 | 1,021 |
We prefer to use non-parametric methods.
Hypotheses Test Results
For the purpose of analysis, the mean difference between each variable on the analysis was observed. The means for functionality, learnability, usability, intuitive, efficiency of using mean of score constructing each variable. Table 3 summarized the means of variables.
Table 3: Summarize of variables means.
| Variable | Pre Test | Post Test |
|---|---|---|
| Efficiency | 7.56 | 7.89 |
| Functionality | 6.3 | 7.65 |
| Intuitiveness | 7.97 | 8.12 |
| Learnability | 7.68 | 7.85 |
| Usability | 12.41 | 12.58 |
When the table is examined, there is an increase in mean scores. Whether there is a significance of mean differences between pre-posttest outcomes, statistical tests are used.
The paired sample t-test is a statistical procedure used to determine whether the mean difference between two sets of observations is zero. One approach you might consider would be to measure the performance of a sample before and after completing the program, and analyze the differences using a paired sample t-test [14] (used on 1th to 10th hypothesis). Statistical significance is determined by looking at the p-value. The p-value gives the probability of observing the test results under the null hypothesis. The lower the p-value, the lower the probability of obtaining a result like the one that was observed if the null hypothesis was true. Thus, a low p-value indicates decreased support for the null hypothesis (Table 4).
Table 4: Paired t-test outcomes.
| Variables | Mean | StandardDeviation | StandardErrorMean | Lower | Upper | Sig. (2-tailed) |
|---|---|---|---|---|---|---|
| Placement ofbuttons | -0.074 | 1,110 | 0.057 | -0.187 | 0.038 | 0.004 |
| Number ofButtons | -0.037 | 1,163 | 0.06 | -0.155 | 0.081 | 0.368 |
| Suitability of userinterface panels | -0.048 | 1,212 | 0.063 | -0.171 | 0.075 | 0 |
| Simplicity of userinterface panels | -0.109 | 1,171 | 0.06 | -0.228 | 0.01 | 0.002 |
| Related ScreenAccessibility | -0.298 | 1,259 | 0.065 | -0.426 | -0.17 | 0.444 |
| Speed | -0.051 | 1,488 | 0.077 | -0.201 | 0.1 | 0 |
| Clarity of guidingmessages | -0.061 | 1,262 | 0.065 | -0.189 | 0.067 | 0.001 |
| Clarity of userinterface panels | -0.035 | 1,021 | 0.053 | -0.138 | 0.069 | 0.002 |
| Ease of use | -0.056 | 1,202 | 0.062 | -0.178 | 0.066 | 0.008 |
| Single screenease of operation | -0.106 | 1,195 | 0.062 | -0.228 | 0.015 | 0.005 |
The Wilcoxon signed-rank test is the nonparametric test equivalent to the dependent t-test. As the Wilcoxon signed-rank test does not assume normality in the data, it can be used when this assumption has been violated and the use of the dependent t-test is inappropriate. It is used to compare two sets of scores that come from the same participants [15] (used on 11th hypotheses).
Mean differences for number of buttons between two design, t score is 0.368 which was greater than 0.05. The 2th hypothesis is supported. There is not a significant difference of number of buttons between two designs (satisfaction level).
Mean differences for two design, for related screen accessibility, t score is 0.444 which was greater than 0.05. The 5th hypothesis is supported. There is not a significant difference of related screen accessibility between two designs (satisfaction level).
There is a significant difference of placement of buttons, suitability of user interface panels, simplicity of user interface panels, speed, clarity of guiding messages, clarity of user interface panels, ease of use, single screen ease of operation variables between two designs.
At least H1 hypothesis is tested with related sample Wilcoxon Signed Rank Test. P-value is 0.00 less than the significant level (0.05). The 11th hypothesis isn’t supported. There is a significant difference of no extra tool needed to complete transaction, between two designs.
In this research we conducted user tests on the interface of core banking screens and identified areas where users were dissatisfied with some statistical tests. Then made improvements for these areas and redesigned the user interfaces. Later again users test are conducted and results are compared. As a result it was determined that the designs made towards the requests of the users increased in satisfaction.
Some improvements made are as follows:
Single screen ease of operation: User interfaces related with authentication are separate from the transaction user interface. Authentication controls are attached to the transaction screen and by this development, the navigation of the users between the screens has been eliminated and operational efficiency was provided.
Clarity of guiding messages: Messages displayed during the transaction have been converted into simplified and clear text messages.
Related screen accessibility: Related operating screens are linked to each other to facilitate accessibility.
Speed: Non-transactional fields have been simplified. Beside this, infrastructural acceleration works have been done. The number of buttons on the screen is decreased and they are also placed compatible with the process flow.
No extra tools needed: Employees needed some tools, such as a calculator, when operating. All calculations are automatically displayed on the screen to stop the use of extra tools.
This study showed us that the user is sensitive about the efficiency. Although the scores of the efficiency variables are found to be increased, there was no difference between the two designs. More attention should be paid to increasing the effective features to attract the attention of users.
For all that, after the improvements are done, the productivity is calculated. It is seen that operational efficiency increased 246 man/year throughout the bank. This has been achieved by integrating the feedback received from the users into the new user interface designs. As seen, incorporating user opinions into user interface/process design and arranging them compatible with user opinions not only contributes to customer satisfaction but also increases the productivity. Indirectly, it also contributes to the more efficient use of human resources.
A well-designed process/user interface may change as conditions change over time. Listening to the user's voice to keep the experience at the top level constantly benefits effective management and sustainability of business processes.
Analyze the experience data of the users, to be able to think within different human beings, to detect the first perception, to create different stories for identifying the user needs that can occur under different conditions, to create projects by considering the user experience, and to achieve efficient results according to the target when completed. "Being able to translate empathy from the user into a system" can be assessed on the skill level of the user experience designer and can be described as a work description. When the user experience is determined and put into practice, the user experience design is also carried out in practice. With this vision, measurable benefits become visible as the developments continue to be presented targeting users [16]. In addition taking opinions of the users before the design, during the design and after the design are the guidance to see the improvement/satisfaction rates. Continuously incorporating the user's view and experience into business processes ensures that businesses remain competitive in today's competitive environment and protects them from useless products/service designs, from potential customer dissatisfaction and loss and from unnecessary costly product/service design [17].
The authors offer special thanks to the Hüseyin AYDIN, CEO of the Ziraat Bank, for his visionary leadership.
Copyright © 2026 Research and Reviews, All Rights Reserved