ISSN: 1204-5357
ISSN: 1204-5357
Indri Ariyanti*
Politeknik Negeri Sriwijaya Palembang, Indonesia, Tel: +62 8117893673; Email: indri3673@yahoo.com
Visit for more related articles at Journal of Internet Banking and Commerce
How do the (father's education, mother's education, children's education, father's income, mother’s income, father's main employment status, mother's main employment status) on the probability of child labor in Palembang City Indonesia. Scope of this research is to analyze or discuss working children 7-15 years old who are working or not working. Primary data was collected through survey technique from 720 samples, a respondent taken by proportionate stratified random sampling and was analyzed by logistic regression model). Factors that significantly affect child labor include: factors children's education, father's main employment status, mother's main employment status. Factors that influence is not significant to child labor include: the father's education, mother's education, father’s income, mother’s income).
Child Labor, Probability, Socio Economic
In relation to child labor, Tjandraningsih [1] says that child labor is children who do routine work for their parents or others, requiring an enormous amount of time to receive remuneration or not. Meanwhile, according to the Central Bureau of Statistics/BPS (2001) working children are those aged 10-14 years and who worked at least one hour continuously during the past week and work to increase family income or household.
According to the International Labour Office [2] the term "child labor" is often defined as work that prevents children in childhood, their potential and their dignity, and that is harmful to physical and mental development.
International Labour Office [3] also explained that child labor is a term used to refer to children who perform work that damages the welfare and prevent education, development and future of the child. Furthermore, ILO [3] describes the working children are children who do the work, the nature of work and/or how it is carried out, abuse, misuse and exploit the child and interfere with their education.
The problem that arises from the definition of child labor because child labor is understood by many people as the children who work in a bad state [4].
Countries that are developing are not always set the minimum age for employment is lower than the age criteria contained in the Convention 138. For example, Brazil, China and Kenya set the minimum age at 16 years, while Germany, Japan, and Switzerland at the age 15 years. Convention 138 was agreed by ILO [3] delegates in 1973 and has diratification by 80 of more than 175 member countries. There are about 168 million child laborers [5] in the world in 2013. They do not enjoy the basic rights to education, physical safety, protection, play and recreation.
Likewise, the data rate of child labor in Indonesia sourced from Statistics Indonesia Jakarta by Ritonga, on the part of some decent work indicators explain the level of child labor (Table 1).
| Sex/Regional | 2011 | 2012 | 2013 | 2014 |
|---|---|---|---|---|
| Male | 4.82 | 4.70 | 3.13 | 3.26 |
| Female | 3.62 | 3.60 | 2.56 | 2.26 |
| Urban | 3.80 | 3.47 | 2.54 | 2.42 |
| Rural | 4.64 | 4.83 | 3.15 | 3.11 |
| Total | 4.23 | 4.17 | 2.85 | 2.77 |
| Source: BPS, Processed from the data NLFS August 2011-2014 | ||||
Table 1: Ratio amount amount against child labour population 10-17.
From the results of this data means that nationally the ratio of child labor to population 10-17 years for men and women are likely to decline. This means that there is a possibility of these children does not work or continue their education to a higher level. It also occurs in the case of rural and urban areas.
Abdalla [6] describes the demand side is affected first, socio-economic factors, namely the request of the company (industry sector), as a family business, their wages are lower than adult workers and not paying taxes. Secondly, technological factors, in the sense that the technology used is still low and use manpower. Third, factors effecting demand in terms of maintaining production quantities, for adult workers is reduced and the restrictions on exports.
Nachrowi et al. [7] explains that the majority of parents believe that giving jobs to children is part of the process of learning to appreciate the work and learn responsibility. Dottridge et al. [8] explains that children tend to be easily intimidated because they are economically dependent, either food or shelter, and sometimes need emotional support.
Asra [9] explains that one of the main factors the existence of child labor is the driving factor (push factor) factor of the household economy, the influence of parents and the low education level of the father or mother, economic pressures families, their view that work is part of the process education, want to help the family economy, because it does not go to school, want to have their own income (Table 2).
| Year | Age 10-14 year |
|---|---|
| 1998 | 68.797 |
| 1999 | 66.449 |
| 2000 | 48.206 |
| 2001 | 48.546 |
| 2002 | 27.539 |
| 2003 | 29.108 |
| Source: BPS South Sumatera Province | |
Table 2: Number of Workers Working Children in the Province South Sumatra Year 1998-2003.
From this data that the number of child laborers in the province of South Sumatra tends to fluctuate from year 1998-2003. This means that from 1998-2003 the number of children there has increased and there is decreased.
Data on the number of boys who work in the province of South Sumatra, published by BPS last in 2003, while for the year 2004 until now unpublished.
From Table 3 shows that in 2012 the percentage of children attending school (254 040/261 234) amounted to 97.24 percent and the remaining 2.76 per cent do not attend school. In 2013 the percentage of children attending school (253 872/262 542) amounted to 96.69 percent and the remaining approximately 3:31 per cent do not attend school. In 2014 the percentage of children attending school (237 216/246 375) amounted to 96.28 percent and the remaining 3.71 per cent do not attend school. This shows that the number of children who attend school tend to decline.
| No. | sub-district | Age child 7-15 | ||
|---|---|---|---|---|
| 2012 | 2013 | 2014 | ||
| 1 | Ilir Barat II | 3.26 | 3.31 | 3.64 |
| 2 | Seberang Ulu I | 12.95 | 12.91 | 15.22 |
| 3 | Seberang Ulu II | 5.47 | 5.50 | 5.48 |
| 4 | Ilir Barat I | 4.85 | 5.18 | 5.55 |
| 5 | Ilir Timur I | 6.68 | 6.03 | 6.46 |
| 6 | Ilir Timur II | 8.82 | 9.14 | 7.63 |
| 7 | Sukarami | 8.68 | 8.90 | 10.10 |
| 8 | Sako | 5.02 | 5.33 | 4.97 |
| 9 | Kemuning | 5.07 | 4.98 | 4.85 |
| 10 | Kalidoni | 11.78 | 11.93 | 7.58 |
| 11 | Bukit Kecil | 3.32 | 3.39 | 3.61 |
| 12 | Gandus | 4.83 | 4.24 | 4.01 |
| 13 | Kertapati | 5.93 | 5.29 | 5.74 |
| 14 | Plaju | 5.17 | 5.30 | 5.67 |
| 15 | Alang-Alang Lebar | 6.24 | 6.59 | 7.25 |
| 16 | Sematang Borang | 1.92 | 1.98 | 2.23 |
| Persentase | 100 | 100 | 100 | |
| Total School Children | 254.030 | 253.872 | 237.216 | |
| N | 261.234 | 262.541 | 246.375 | |
| Source: BKKBN Palembang 2014 | ||||
Table 3: Percentage Number of Children Age 7-15 in Palembang Year 2012 – 2014.
The school of the amount they should not enter into the job market, but in reality children aged 7-15 have a lot that goes into the job market and labor. This is because family income is less so that the child is expected to contribute to the family income.
The limited study and attention to the working conditions of children in Indonesia, especially in the city of Palembang contributed to terbelenggunya fate of child labor. Circumstances experienced by child labor and the responsibility to contribute to the family quite interesting phenomenon researchers to raise issues about them.
Formulation of the Problem
In line with the background and the previous description, the problem in this research is: How can socio-economic factors influence the probability of child labor in the city of Palembang.
Research purposes
In accordance with the background and problem, the purpose of this research is to find out the influence of socio-economic (father's education, mother's education, children's education, father’s income, mother’s income, status of father’s main job, status of mother’s the main job) on the probability of child labor in Palembang.
Benefits of research
The expected benefits of this research are divided into two, namely academic and practical benefits. The Academic benefit expected from this research is that the result of this research is the development of the Theory of New Home Economics and Theory of Household Survival Strategy. The Theory New of Home Economics learns the relationship between labor supply (job offers) and families decisions on economic activities. The Household Survival Strategy Theory learns if economic conditions change or became worse, the family will take an advantage of the resources available in the family.
Furthermore, practical benefit expected from the results of this study is that through the information about the influence of socio-economic (father's education, mother's education, children's education, father’s income, mother’s income, status of father’s the main job, status of mother’s the main job), on the probability of child labor in Palembang, can provide useful input for stakeholders (government or employers) in makes decisions related to the issue of child labor. In addition the results of this study can be used as a reference for similar studies in future.
Theory on New Home Economics
In the concept of New Home Economics [10] the term 'household' is used to distinguish the activities of the 'market' (labor market). The labor market results in exchange for money. For example, bathing and sleeping are household activities undertaken by an individual who does not make money.
Becker [11] is one of the economists whose ideas should be considered in discussing the labor supply, namely the theory of New Home Economics. Becker’s [11] famous theory for can develop some new concepts that are not addressed in traditional economic theories, such as: household production function, household commodity, household-time, full income.
New Home Economic theory assumes that each individual acts as both producers and consumers. In addition, items such as chairs, tables, pickles and some other goods that are sold in markets are not (final goods), but they still need treatment with a variety of other inputs such as time, and supporting equipment, so that these goods can be directly consumed known as the 'Household commodity'.
Becker [11] describes that the New Home Economics is a part of economic theory related the theory of the behavior of households (individuals) who try to meet their satisfaction. Maximum satisfaction is analyzed based on household consumption of commodities (goods and services) to obtain the desired level of satisfaction. The Concept of New Home Economics is considered to have a broader analytical framework in addressing the various behaviors of household members in conducting economic activities. It especially overviews the relationship between job after (labor supply) and household decisions in economic activities. It’s general is to analyze participation rate labor force. For example, we see the effect of the parent’s income increase on the level of children participation in for helping the family’s economy. But the increase does not affect the value of the children’s time. The effect of this increase is the rise in the number of normal commodities. Because commodities are produced using inputs of time and goods, these will reduce the amount of time that is sold to the market by several family members. Finally, it can be concluded that the increase in the parent’s income can lower labor force participation rates of children. First, someone needs time to fulfill a variesty of basic necessities, such as: sleeping, eating, drinking, taking rest and all time needed for activities that are not included in labor force participation. This pattern is called non-market consumption activity. Second, someone needs time to enter job field (labor force participation). Third, an individual needs time for investigation in human capital (human capital). The accumulation of human capital will ultimately increase their wages or salary [12].
Theory of Household Survival Strategy (Strategy Maintaining Household Survival)
The phenomenon of child labor is related to the theory of household survival strategy (a strategy to maintain the survival of the household). This theory states that if economic conditions change or worsen, a poor family will utilize available resources. One effort that is often done in order to sustain life is by using family labor, if the adult labor force is already absorbed in all various sectors, will be involved to wore in order, to meet the necessities.
Theory of Economic Value of Children
In term of economics, the theory of economic value of children was first popularized by Leibenstein [13] which says that a person's decision to have children is based on the approach of children cost and benefits (The Benefits and Cost of Children Approach). In general a child has values (1) the value of the child himself (satisfaction and pride) (2) As a labor source/sources of income in the future (3) As a life guarantee for both parent’s old days. Furthermore the costs caring for the children (the cost of child care) include among others: (1) Pregnancy cost (2) birth delivery cost (3) The cost for meeting the needs of the children (consumption) (4) The costs of education, health, recreation and others.
In the socio-economic context, especially in terms of employment, there are at least two theories trying to explain why children work, seen from the demand side and the supply side. Tjandraningsih [1] explain that there are theories of children employment. First, the theory of the demandt, statines that the employment of children and women is considered as the second labor force and doubles the profits. Second, the theory of the supply side, explains that poverty is the main reason that encourages children to work monder to ensure the survival of their families. Furthermore Haryadi and Nana [14] suggests that employers especially prefer to employ children because of their agility and efficiency in doing their jobs. Their jobs do not require high positions and can be done fast. Nachrowi and Salahudin [14] also argue from the two same sides, that is the demand side and the supply side. From the demand side, the demand for child labor is largely determined by the needs of the companies. They know that it is appropriated to employ children because they can be paid with law salary. The theory of the surpplus, staties that the availability of child labor is highly dependent on the participation of children in schools and the availability of their free time, especially for children who work part-time.
Irwanto et al. [15] suggests that there are three theories, the first, the theory of culture. According to the culture theory, in certain cultures, children are expected to gain, adults working experience since they are young. The second is the theory of poverty. The factors underlying the phenomenon of working children are poverty. Therefore, poverty must be targeted intervention. This situation cannot be ignored. Most of the incomes of the parents with working children are minimal and many of them are single parents women are the family heads women. The third is economic theory. This theory states that rational economic calculation is the main motivation behind the issue of child labor. The consideration of high cost because of the missing probability to earn income due children is the main driving factor. This is offset by the interting bargain (industries and brokers), while the treatment of children’s subject to the law of the balance between demand and supply.
Abdalla [6] explains that the existence of child labor can be influenced by market forces and the expansion of child labor (child labor). Viewed from the supply side, the existence of child labor may be due to these factors. The first, family income and adult workers. The second is attitude and ability in school. The third is because of tradition or culture. Furthermore, the existence of child labor if viewed from the demand side can be caused by their factors. The first is socio-economic factor, namely the request of the company (industry sector), as a family business, their wages are lower than adult workers and not paying taxes. The second is technological factors in which the technology used is still low and use manpower. The third is factors effecting demand in terms of maintaining production quantities, for adult workers is reduced and the restrictions on exports.
Child labor, especially for low-income households, becomes a first-aid measure to reduce the economic burden of parents. White et al. [16], ILO-IPEC [17] also explains that economic problems for low income families whose family heads have low educational background of household heads and jobs as laborer factory workers, retailers, and construction worker cause their children to work.
In the context of child labor, the definition of a child Age Convention No. 138 (Minimum Age Convention Work), ratified by the government through Law No. 20 of 1999, is any worker under 15 years old. The UN Convention on the rights of children (The United Nations Convention on the Rights of the Child), ratified by Presidential Decree No. 36 1990, and the ILO Convention to 182 concerning the prohibition and immediate action for the elimination of child labor, ratified by Law No. 1 Year 2001, explains that the age limit of the child is under 18 years old. According to the Child Welfare Act (Act No. 4 of 1979), the child is under 21 years old and has never been married. Juvenile Court Act No. 3, 1997 decides that the child is a person under 18 years old. Tjandraningsih [1], White et al. [16] provides a definition of a child labor without specifying an age limit, but there are economic activities done by children by devoting a lot of time and getting salaries. According to him, working children are children who do the work on a regular basis for parents or others, which requires a certain amount of time, with or without getting payments.
In Indonesia, the terms “laborer” and worker are distinguished. The word laborer is always defined as a worker who does hard work and is prone to exploitation, such as docker are farmers. Meanwhile, a worker or staff are often addressed a worker who does light work and “is not prone to exploitation". According Suyanto [18] the term “laborer” and employees are used as a symbolic instrument for different social groups to promote their own ideologies in industrial relations, thereby controlling the activities of the labor movement.
ILO [3] explains that is no common perception, thereby causing children go on working; in fact they are supposed to play and study. The parents continue to enjoying their children’s income. The contribution of child labor for the family is not small. It is that child workers contribute 20 percent in average for the family economy. This figure appeared in a report revealed in the UN conference on the settlement issue (Habitat II) in Turkey in 1996.
As a family of Economic Unit
Ware [13] describes the parent’s calculation of the benefits derived from raising their children, need to be estimated towards the labor or the income of their children. The parent’s calculation towards the costs of raising children is influenced by their perceptions to reduce or share these costs. Further Ware [13] explains considering the direct and indirect educational costs are high, it is understandable those educated parents’, psychologically not have the option to raise illiterate children, should be among the pioneers in limiting families size restrictions around the world. The choices of the poor are limited by their poverty, meanwhile the choices of the educated people are limited by the need to maintain their status.
Child Economic Activities
Working with a very detailed time budget for the village children individually in Java, White et al. [16] have produced evidence that the "children of large families tend to be more productive than children in small families." this is probably because the younger children in these families learn from the example of their older siblings, and also because they have been studying the small duties, they release their older siblings for more productive jobs.
Child as a Burden or Investment
Ware’s Research [13] explains that a marked difference between those who argue that children are burden (Mueller, Ruprecht and Jewett, Enke, Neher, Ohlin) and those who argue that children are a reasonable investment (Caldwell, White, Hull, Mamdani, and Ruzicka) is that the first opinion is highly dependent on manipulations complex statistical of aggregate data drawn from a series of sources and even culture, while the second opinion is regarding the consideration of all available data, both economic and cultural , which relate to the situation of certain locations.
Supply Side of Child Labour
ILO [3] explains that economists prefer to sort factors according to whether they operate on the "supply side" or "demand side" of the market. The market is an institution that brings buyers and sellers together to determine what will be redeemed at a price [3]. In the case of child labor, markets including those who provide child labor, such as household where children live, and those who use them.
Family Factor
In most societies, families are directly affect the child's emotional and introduced to the life in the community, the first contact with the outside world. Most children start to work helping their families, before they go to work for someone else. They did it not only partly because of poverty, but also, in many societies, due to cultural values and expedition to introduce children to the roles and responsibilities related to a member of a family.
The pattern of children helping parents is common in many societies. Children help their parents in small shops and commercial activities, or in a small home-based business.
The tendency of children to help their parents or share the workload is much less than the workload of working parents in urban or institutional such as factories or offices. Families of children who work tend to be larger families (larger than average for the area where they live) and children who most often go out to work is the older, or the second oldest. It is very common for family economic burden falls on the eldest.
Factor’s Poverty
Not surprisingly, the prevalence of child labor is highly correlated with the level of average society’s incomes. Although it must be careful about the numbers on the vertical axis: where the data do not include illegal or hidden child labor that characterizes even some of the richest countries.
The entry of capitalism in Indonesia is believed to have destroyed the social value of society, where the upper class of society experienced westernization and urbanization, while the lower class becomes increasingly poor. Poverty becomes a trigger factor in human rights abuses on children. Children in poor families experienced double subordination, i.e. there is suremiation from of the rich and adults. Child rights may be violated since he is still a child and poor.
Bhalotra using a variety of methods to examine the relationship between poverty, wages and hours spent in wages. What he found was that, for boys, lower wages mean more hours spent on the job, exactly as predicted in conditions of severe poverty, whereas this effect does not apply to girls. On the other hand, household income has the effect of lowering girl's working hours, but have less effect on the boy. In this example can be seen in the interaction of the general economic pressures, the role of poverty and cultural norms.
Factors of Economic Inequality
Globalization and economic liberalization is a condition that may not be inevitable. On the one hand, globalization is an opportunity when it is ready to face it, but on the other hand, globalization is a challenge in a very tight competition.
Capitalism has ruined the economic order of Indonesian society, resources are targeted to exploit both natural and human resources. Therefore, the use of child labor as a resource is an economical choice (cheap). Child labor is paisley recruited and not difficult to get fired, because of the nature of their dependent and helpless.
In addition, the cost of education in Indonesia is still high which also smaller their chance to get education. Government problematic in pressing the number of child labor not only to punish parents who exploit children to work, but the government should also provide alternative economic sector to the poor so they can keep working and not using children to work together, also revamping education to give probability for poor people to stay in school such as letting exemption of school fees to reduce the number of children dropping out of school [3].
Factor’s Economic Shocks
For one year or several years, households may have adequate income overall, but there may be periods of distress. This is especially happened with small-scale agriculture, when market revenue dependent on one crop, which may face malfunction because of weather or pests, changes in prices, or other unexpected events.
Demand-side Factors of Child Labor
The demand side refers to the factors that encourage employers to engage children as workers, while the supply side of the child labor market consists of all the leading domestic strength to offer their children work, temporarily. Together, the supply side and demand affect the amount of child labor, productivity, and total compensation of children. The more pressure applied to the supply side (i.e. more households offer child labor), the less productive labor and labor is likely to be paid. The more and more pressure is applied on the demand side (i.e. the use of child labor more), the more productive is paid. Both kinds of pressure tend to increase the overall amount of labor. Analysis of family structure is intended to explain the children in the household will be instructed or encouraged to work.
Michael [19] explains that the transformation of the work requires more than just law enforcement; also demands the new cultivation, more productive work system based on the active participation of the workforce. The presence of a large number of children in the labor force is a sign that the job has organized on the basis of basic skills. Greater attention to the organization of work and better access to capital should produce less working children, even with no change in the supply side, additional adult labor is provided. Even in the production of household, more sophisticated farming methods, for example, can reduce the need for a large number of child labor.
Logistic regression model is used to look at the probability of occurrence of a state by considering factors that influence and compared their risk of developing a condition due to a factor after considering other factors in the model [20]. Meanwhile, according to Gujarati [21] explains that the logistic model is often used in the classification data.
Previous Research
Based on SMERU, many factors that cause children to work, but it is economic factors that most strongly encourage them to actively participate in economic activities.
Approximately 50 per cent of child labors are still enrolled at school. The rest, about 45 percent of child labors are school dropouts, while 5 percent have not enrolled in school. Supported by the findings of similar studies in other countries [22]. Research SMERU also showed that the higher the level of education of the head of household, the lower the possibility of the existence of child labor in the family. Approximately 90 of all children labor come from households with the highest educated household head of primary schools.
Manurung [23] explains that child labor live in rural areas, mostly working in agriculture. Furthermore, by considering socio-economic factors head of the family, then the existence of child labor in general, due to economic pressures families (poverty) is seen by the head of family wages are far below the national average of the minimum wage. When viewed from the level of education of the head of the family, most of the head of family finished primary school or lower level of it. For the head of the family gender factor, then if it is headed by a woman, the children tend to work compared to male as the heads of family.
Harper et al. [24] describes the child poverty is defined in three main areas: (1) Security and capacity in the household livelihoods. (2) The relations of social and capital (3) the opportunity for the development of human capital solutions specific policy in economic policy, but actively supports social relationships and human resources. Developing better data. Micro-macro policy solutions are run through all policies.
According to Marie et al. [25] child labor is not efficient if it is used by parent’s as a substitute (for a transfer of income from children to the parent’s) or because of imperfections of capital markets, as replacement a loan (to transfer income between now and the future).
Beegle et al. [26] concluded that (1) Effect of Shocks: that domestic child labor substantially experiencing income shocks. (2) Effect of Credit: that the source of wealth and income remains positive. Where the variable additional wealth statistically significant from the coefficient reduced interests. (3) That the income shocks positively correlated with household income. (4) There is a correlation between income shocks to credit access, which is indicated by the value of assets and child labor. (5) Improvement Child labor is significantly negative on income shocks.
Cockburn [27] explained that (1) Function of Household Income derived from agriculture household capital with child labor input. (2) The significance among households was varying in the marginal productivity of average children. Total revenue contributions child labor ranging up to a maximum of 52.3 from Household income. (3) Productivity of child labor is very strong and positive compared with the number of adults in the household.
Rosati et al. [28] found that (1) Determine the duration of working is important to assess the impact on the health of children in the accumulation of human capital. (2) The importance of considering decisions about the school and working hours of children by assessing the different explanatory variables. (3) The structure of the model allows the marginal effects will be calculated depending on the latent variables that indicate households will send children to work or not. (4) Case revenue showed that policies that aim to reduce child labor by introducing intensive schemes (such as income transfers) in which only a few are modifying it so as to produce a more significant effect on poor households to send children to work or school.
Siddiqi et al. [29] suggested that (1). Collecting the data of child labor and designing interventions that allow children to be in school and work. (2) Improving the quality of schools by investing in education so increase the value of children and the elderly. (3) Providing subsidies for poor families who have working children so they can afford to send their children to school (subsidy income, supplement/nutrition). (4) Building International organization partnerships dedicated to improve the lives of children.
Webbink et al. [30] Showed that (1) The effect of socio-economic factors explained that the characteristics of the family is reflecting family structure associated with child labor. Where the family background that makes a huge difference to the job of children. (2) The effects of factors context of urbanization context, level of development, and the country's GDP per capita also have an effect on child labor. (3) The difference of the context of the resources also affects child labor.
Furthermore Webbink et al. [31] added a follow up research that (1) household was the most important factor that could explain variations in the forms of work. (2) In the household where the mother has education, the less time for children to work. Meanwhile, when the father has education the children tend not to work. (3) For households that have no land or livestock (cattle), the boys and girls will work. (4) Household work depending on the age and birth order of the child. (5) When the father is not there, the children spend more time at work, and vice versa if the mother is not there then no significant effect.
Similarly, Wu [32] explains that household income Effects shift labor child to work more than school. But revenues have neglectible effect on the wages towards the number of children working hours. From age 12 onwards, especially boys will change from working in the household to work outside the household, where the effect of wages on the job that may separate them from their families. But to the accumulation of human capital and the separation of families will be less if the child is educated at home.
Based on previous studies as described above, the data showed empirically that the factors that affect child labor to enter the labor market are economic factors, poverty, parent’s status, parent’s education, family size, birth rates, parent’s income and area of residence. Based on the results of theoretical study of empirical fact, this research will try to analyze the influence the factors of father's education, mother's education, children's education, income fathers, mother’s income, father’s main employment status, mother’s main employment status, in Palembang city.
This research is the development of the Theory of New Home Economics and Household Survival Theory. New Home Economics theory that address various behaviors of household members in conducting economic activities. Household Survival Strategy Theory see if economic conditions change or worsen, then the family will take advantage of the resources available in the family. Determining the location of this research was conducted in Palembang city. Orisionalitas this study in terms of the object of research is that research on children labor in Palembang is still limited.
Framework
Based on the literature review and theoretical frame, then the framework is created as follows: analyzing the influence of socio-economic (father's education, mother's education, children's education, father’s income, mother’s income, father’s main employment status, the mother’s main employment status) on the probability of child labor to family income (Figure 1).
The model in this study is based on researches of Wu [32], Webbink et al. [30,31], Syahruddin [33], Rosati et al. [28], Beegle et al. [26], Cockburn [27], Usman [20], Manurung [23], Asra [9], Edmonds et al. [34,35], Edmonds [36], ILO [3,37].
Not all variables in the studies model used in this framework.

Figure 1: Effect of socio economic factors against child labour.
Hypothesis
1. It is hypothized that Father’s Education influence the probability of child labor in Palembang city significantly
2. It is hypothized that Mother’s Education influence the probability of child labor in Palembang city significantly
3. It is hypothized that Children’s Education influence the probability of child labor in Palembang city significantly
4. It is hypothized that Father’s income influence the probability of child labor in Palembang city significantly
5. It is hypothized that Mother’s income influence the probability of child labor in Palembang city significantly
6. It is hypothized that Father’s main employment status influence the probability of child labor in Palembang city significantly
7. It is hypothized that Mother’s main employment status influence the probability of child labor in Palembang city significantly
The scope of research
Scope of this research is to analyze or discuss working children aged from 7-15 years old who are working or not working viewed from of socio-economic factors [38-40]. The unit of analysis in this study is a family/household with children aged from 7-15 years old.
Respondents in this study were children aged from 7-15 years who are working or not working. Determining the location of the research was conducted in the city of Palembang. Secondary data were used as references for research is data from the BKKBN and BPS Palembang.
Data and Data Sources
Types of data collected are primary data and secondary data. Primary data is data obtained directly from respondents related that is the object of research is child labor in the city of Palembang [41]. Secondary research data is the data obtained from the literature related to the research obtained from various sources such as BKKBN, BPS and other sources.
The sampling technique in this research is the probability sampling. Probability sampling is used is proportionate stratified random sampling means that sample of members of the population at random and stratified proportionally, these populations are taken if members of the population is heterogeneous (dissimilar).
The sampling technique started from the election districts that have children aged from 7-15 years (Table 4.) in the city of Palembang in 2014 which amounted to 16 districts [42-45]. Furthermore, from 16 subdistrict in Palembang have as many as 8 sub-districts (50 percent of all districts) are considered to be representative of the 16 districts in the city of Palembang, and have the number of children who categorized the highest amount, medium and low.
| No. | Sub-district | Age child 7-15 |
|---|---|---|
| 1 | Ilir Barat II | 8,847 |
| 2 | Seberang Ulu I | 37,843 |
| 3 | Seberang Ulu II | 14,173 |
| 4 | Ilir Barat I | 14,599 |
| 5 | Ilir Timur I | 15,351 |
| 6 | Ilir Timur II | 18,241 |
| 7 | Sukarami | 24,358 |
| 8 | Sako | 12,005 |
| 9 | Kemuning | 11,551 |
| 10 | Kalidoni | 18,267 |
| 11 | Bukit Kecil | 8,613 |
| 12 | Gandus | 9,559 |
| 13 | Kertapati | 16,476 |
| 14 | Plaju | 13,454 |
| 15 | Alang-Alang Lebar | 17,220 |
| 16 | Sematang Borang | 5,418 |
| JUMLAH | 246,375 |
Table 4: Number of Children Aged from 7-15 2014 at the 16th District in the city of Palembang.
Tables 5-8 shows the selected sub-district that has the number of children aged from 7-15 years with high levels of as much as 3 districts, levels were as much as three sub-districts and lower levels as much as 2 districts.
| No. | Subdistrict Selected | Population |
|---|---|---|
| 1 | Seberang Ulu I | 37,843 |
| 2 | Sukarami | 24,358 |
| 3 | Kalidoni | 18,267 |
| 4 | Ilir Barat I | 14,599 |
| 5 | Seberang Ulu II | 14,173 |
| 6 | Plaju | 13,454 |
| 7 | Bukit Kecil | 8,613 |
| 8 | Sematang Borang | 5,418 |
| Total | 136,725 | |
| Source: BKKBN Palembang 2014 | ||
Table 5: Total Soul Aged from 7-15 Years 2014 (8 sub-districts) in Palembang.
Table 6. shows of each 8 districts three villages which also has a number of children aged from 7-15 years with high levels of one village, sub-district level was 1 lower and 1 sub-district levels will be selected again.
| No. | Village of Selected | Population | Sample |
|---|---|---|---|
| 1 | 5 Ulu | 6,049 | 30 |
| 9-10 Ulu | 3,730 | 30 | |
| Tuan Kentang | 2,020 | 30 | |
| 2 | Kebun Bunga | 5,818 | 30 |
| Sukadadi | 3,120 | 30 | |
| Talang Jambe | 1,829 | 30 | |
| 3 | Sungai Selincah | 5,306 | 30 |
| Bukit Sangkal | 3,452 | 30 | |
| Kalidoni | 2,284 | 30 | |
| 4 | Bukit Lama | 4,305 | 30 |
| Demang L. Daun | 2,486 | 30 | |
| 26 Ilir D. 1 | 512 | 30 | |
| 5 | 16 Ulu | 2,607 | 30 |
| 14 Ulu | 2,248 | 30 | |
| 12 Ulu | 1,137 | 30 | |
| 6 | Talang Putri | 2,810 | 30 |
| Plaju Darat | 1,778 | 30 | |
| Komperta | 786 | 30 | |
| 7 | 24 Ilir | 4,025 | 30 |
| Talang Semut | 1,025 | 30 | |
| 19 Ilir | 274 | 30 | |
| 8 | Lebung Gajah | 3,039 | 30 |
| Karya Mulya | 871 | 30 | |
| Srimulya | 706 | 30 | |
| Total | 62217 | 720 | |
| Source: BKKBN Palembang 2014 | |||
Table 6: Number of Children Aged from 7-15 Years 2014 (24 village) in Palembang.
Of the election will come 24 villages selected. Then from each village will also be selected by simple random sampling of 30 families with children aged from 7-15 years, so the total number of children is 720 people.
Analysis method
Methods/techniques of analysis used in this research is descriptive and inferential analysis, which is to look at the factors that influence child labor and its contribution to the family income. Because the dependent variable was a dichotomous classification, namely: children who work and do not work, then the model used in this study is a logistic regression model [46].
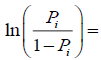
Selection of logistic regression model or a logistic model in this study applied because due to logistic regression is more easily applied and interpreted. Logistic model is a model that follows the logistic distribution function in equation (1), the definition as follows:
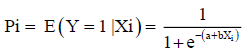
Where Pi represents a probability. In this research the above model can be simplified as follows:
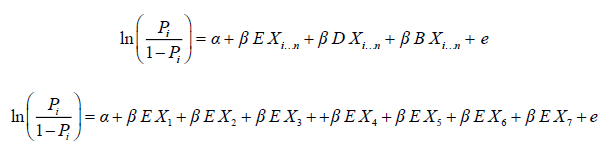
Where:
1.  Variable probability of children aged from 7-15 years old who work to earn income and children aged from 7-15 years old who are not working.
2. Ex1=Father's education
3. Ex2=Mother's education
4. Ex3=Children’s education
5. Ex4=Father’s income
6. Ex5=Mother’s income
7. Ex6=Father's main employment status
8. Ex7=Mother's main employment status
9. e=Error term
With the model (3) it can be estimated the probability of child labor. Thus obtained results of probability based on socio-economic factors can be obtained [47,48]. In order to choose the right model to explain the influence of these variables in this study, then do some testing regressions model, namely: the entire test models and test the significance of each parameter (Wald test) (Table 7). To see any direct or indirect influence of the independent variables on the dependent variable p values is compared for each independent variable with the restriction p=0.05, whereas to see risks among a group of individuals into different categories used statistical odds ratios [49].
| Variable | Operational Definition | Indicator | Measure |
|---|---|---|---|
| Children | Children aged from 7-15 years | Working and not working | 0=not working 1=working |
| Father’s Education | Highest level of education attained by the father. | Not graduated from high school and graduated from high school | 0=Not graduated from high school 1=graduated from high school |
| Mother’s Education | Highest level of education attained by the mother. | Not graduated from high school and graduated from high school | 0=Not graduated from high school 1=Graduated from high school |
| Children’s Education | Education have been followed by the child. | Schools and school. | 0=not working 1=working |
| Father’s Income | Father all income in the form of salaries, wages and benefits. | Total father’s income day | Rupiah |
| Mother’s Income | Mother’s all income in the form of salaries, wages and benefits. | Total mother’s income day | Rupiah |
| Father’s Main Employment Status | Notch father in business/activities do work | Informal and Formal | 0=formal 1=informal |
| Mother’s Main Employment Status | Notch father in business/activities do work | Working and not working | 0=not working 1=working |
Table 7: Variable Operational Definition.
Characteristics of Respondents
This analysis aims to determine differences in the characteristics of child labor by socio economic (father's education, mother's education, children's education, income father, income mothers, main employment status father, the status of the main job's mother), demographic factors (the presence of parents, gender, the child's age, order of birth, number of household members), culture (the patriarchal kinship system and discipline). The sample size for this study is 720 samples [50-53]. To see how many respondents participated in conducting questionnaires which describes the number of respondents was 720 children, where data is lost (missing) not at all (0). Total respondents 720 children are at 100 percent. This means that all respondents fill out the questionnaire and involved 100 percent.
Table 8 Children seen that the frequency of work or not work is as much as 211 children who do not work, while the remaining 509 working children. This means that the children in this study respondents who work more than young respondents that did not work. Based on the data in the field that the children who work in large part due to help the family economy, follow friends, leisure time and some even as far away from the location of the school [54].
| Kids | Frequency | Percentage |
|---|---|---|
| Not working | 211 | 29.3 |
| Working | 509 | 70.7 |
| Total | 720 | 100 |
| Source: Research Findings 2015 (processed) | ||
Table 8: Number of Respondents by Children Condition (Working or Not).
Table 9 shows that for children who are not working with the father's education is not completed high school and working in the formal sector is much less than the father's education had not completed high school and working in the informal economy. Children who do not work with the education my father graduated from high school and worked in the formal sector is more than the father graduated from high school education and work in the informal economy [55].
| Children | Father’s Main Employment Status | Total N | |||
|---|---|---|---|---|---|
| Formal | Informal | ||||
| Not working | Father’s Education | Not graduated from high school | 29.4 | 49.8 | 167 |
| Graduated from high school | 12.8 | 8.1 | 44 | ||
| Total | 42.2 | 57.8 | 211 | ||
| Working | Father’s Education | Not graduated from high school | 24.8 | 66.8 | 466 |
| Graduated from high school | 2.6 | 5.9 | 43 | ||
| Total | 27.3 | 72.7 | 509 | ||
| Total | Father’s Education | Not graduated from high school | 26.1 | 61.8 | 633 |
| Graduated from high school | 5.6 | 6.5 | 87 | ||
| Total | 31.7 | 68.3 | 720 | ||
Table 9: Proportion of Respondents by Father’s Education and Father’s Main Employment Status.
Table 9 also showed that child labor with no education fathers graduated from high school and worked in the formal sector is much less than the father's education had not completed high school and working in the informal economy. Child labor with education father graduated from high school and worked in the formal sector is more than the father graduated from high school education and work in the informal economy [56]. Based on the research that the number of respondents by father graduated from high school education was 87.9 percent and 12.1 percent had not completed high school. For a number of respondents to the father's job status in the formal sector as much as 31.7 percent and 68.3 percent informal.
This means it can be concluded that the father to finish high school education less than high-school dropout. The results showed this was due largely father's education did not finish high school is completed primary school and some have not completed primary school [57]. This means that knowledge of father of the importance of education for the children's future is very minimal. If this study assumes that the views of parents of children who work (child labor) is represented by education, then the situation can be concluded that the father's education who did not finish high school are more receptive to his work.
Table 10 shows that children who do not work with the mother's education did not finish high school with the main employment status mothers do not work greater compared with maternal education graduated from high school with the main employment status of working mothers. Children who do not work with the mother's education graduated from high school with the main employment status mothers do not work greater compared with maternal education graduated from high school with the main employment status of working mothers. This indicates that maternal education graduated from high school and did not finish high school are less likely to work.
| Child | Mother’s Main Employment Status | Total N | |||
|---|---|---|---|---|---|
| Not working | Working | ||||
| Not working | Mother’s education | Not graduated from high school | 55.0 | 26.5 | 172 |
| Graduated from high school | 13.3 | 5.2 | 39 | ||
| Total | 68.2 | 31.8 | 211 | ||
| Working | Mother’s education | Not graduated from high school | 54.8 | 37.1 | 468 |
| Graduated from high school | 3.7 | 4.3 | 41 | ||
| Total | 58.5 | 41.5 | 509 | ||
| Total | Mother’s education | Not graduated from high school | 54.9 | 34.0 | 640 |
| Graduated from high school | 6.5 | 4.6 | 80 | ||
| Total | 61.4 | 38.6 | 720 | ||
| Source: Research Findings 2015 (processed) | |||||
Table 10: Proportion of Respondents by Mother’s Education and Mother’s Main Employment Status.
Based on the research that the number of respondents by primary job status mothers is 442 people out of work, or by 61.4 per cent, then the main employment status of working mothers as many as 278 people or 38.6 per cent [58].
This means it can be concluded that the lowest frequency is 38.6 percent for women who did not work and the highest frequency of 61.4 percent of the work. This is because the job status mother works as a housekeeper, laundress and selling food.
So even if the mother's education graduated from high school and high-school dropout when associated with maternal employment status that more does not work of course the family income is less and cause children involved in helping to work and increase family income [59].
Table 11 shows for children who do not work with the child's education no more old school 8 years (2.4 percent) compared with other age. Children who do not work with the child's education schools are 10 years old and 15 years (12.3 percent). Likewise for working children (child labor) with the child's education no more schools aged 15 years (4.1 percent) compared with other age, and children who work (child labor) with the child's education schools are 13 years of age compared with age more.
| Child | Age | Total N | ||||||||||
|---|---|---|---|---|---|---|---|---|---|---|---|---|
| 7 | 8 | 9 | 10 | 11 | 12 | 13 | 14 | 15 | ||||
| Not working | Children’s Education | Not working | 2 | 2.4 | 1.9 | 0.5 | 0.9 | 0.9 | 0.5 | 0.5 | 1.4 | 23 |
| Working | 8.5 | 10 | 12 | 10 | 11 | 10 | 7.1 | 12 | 188 | |||
| Total | 11 | 12 | 13 | 11 | 12 | 10 | 7.6 | 14 | 211 | |||
| Working | Children’s Education | Not working | 1 | 1.6 | 2 | 3.9 | 3.7 | 3.9 | 2.8 | 3.5 | 4.1 | 135 |
| Working | 2 | 2.9 | 5.5 | 7.5 | 8.6 | 12 | 12 | 11 | 11 | 374 | ||
| Total | 3 | 4.5 | 7.5 | 11 | 12 | 16 | 15 | 14 | 15 | 509 | ||
| Total | Children’s Education | Not working | 1 | 1.8 | 1.9 | 2.9 | 2.9 | 3.1 | 2.1 | 2.6 | 3.3 | 158 |
| Working | 4 | 4.6 | 6.9 | 8.9 | 9.2 | 12 | 12 | 9.7 | 12 | 562 | ||
| Total | 5 | 6.4 | 8.9 | 12 | 12 | 15 | 14 | 12 | 15 | 720 | ||
Table 11: Proportion of Respondents by Children’s Education and Children’s Main Employment Status.
Based on the results of the study showed that for the education of school children as much as 158 people or 21.9 percent of children of school as much as 562 people or 78.1 per cent. This means it can be concluded that the education of children who attend school for more than no school. This shows that children who work and attend school due to a larger percentage of children aged from 7-15 years was supposed to dedicate more time to be in school or studying.
Table 12 shows for children who do not work with the father's main job status in the formal sector with revenues greater 1000-160000 father rupiah compared to other income. Children who do not work with the father's main job status in the informal sector larger by revenue 1000-160000 rupiah compared to income of other fathers [60]. Table 4 shows for children who do not work with the father's main job status in the formal sector are greater with revenue 1000-160000 rupiah compared to income of other fathers.
| Anak | Father’s income (10.000 rupiah) | Total N | |||||||
|---|---|---|---|---|---|---|---|---|---|
| Not income | 0.1-16 | 16.1-32 | 32.1-48 | 48.1-64 | 64.1-80 | ||||
| Not working | Father's main job status | Formal | 4.7 | 27 | 0.9 | 0 | 0 | 10 | 89 |
| 1.4 | 54 | 2.8 | 0 | 0 | 0 | 122 | |||
| Total | 6.2 | 80 | 3.8 | 0 | 0 | 10 | 211 | ||
| Working | Father's main job status | Formal | 3.9 | 22 | 1.2 | 0 | 0.4 | 0 | 139 |
| 1 | 68 | 2.8 | 1 | 0.2 | 0 | 370 | |||
| Total | 4.9 | 90 | 3.9 | 1 | 0.6 | 0 | 509 | ||
| Total | Father's main job status | Formal | 4.2 | 23 | 1.1 | 0 | 0.3 | 2.9 | 228 |
| 1.1 | 64 | 2.8 | 0.7 | 0.1 | 0 | 492 | |||
| Total | 5.3 | 87 | 3.9 | 0.7 | 0.4 | 2.9 | 720 | ||
Table 12: Proportion of Respondents by Father’s Main Job Status and Father’s Inco.
While the children are not working with the father's main job status in the informal sector larger by revenue 1000-160000 rupiah compared to income of other fathers. Child labor by status father's main job in the formal sector with revenues greater 1000-160000 father rupiah compared to other income. Child labor by father's main job status in the informal sector larger by revenue 1000-160000 rupiah compared to income of other fathers.
This means that the income of father in both the formal and informal sectors with a child who does not work and child labor more revenue 1000-160000 thousand rupiah. This indicates that the father revenue decreases when associated with most of the father's job status in the informal sector is a parking lot, motorcycle taxi drivers, day laborers and others [61]. The results showed that the number of father who worked informal sector was 68.3 percent and the mothers who did not work 38.6 percent. Even the smaller family income if the mother did not work, so the child will be involved to contribute to the family income.
Table 13 shows for children who do not work with the job status mothers do not work more that there is no revenue compared to other income. As for children who are not working with the main employment status of working mothers is greater with an income of 1000-60000 rupiah. Table 4 also showed that for children who work with job status mothers do not work more that there is no revenue compared to other income [62]. As for children who are not working with the main employment status of working mothers is greater with an income of 1000-60000 rupiah. This means that mother’s income per day can help supplement the family income, but the income of the mother are important when viewed from the father's job status that more work in the informal sector, so that not only mothers who are expected to contribute even children are also contributing to the family income.
| Child | Mother’s (10.000 rupiah) | Total | |||||||
|---|---|---|---|---|---|---|---|---|---|
| Not Income | 0.1-6 | 6.1-12 | 12.1-18 | 18.1-24 | 24.1-30 | ||||
| Not-working | Mother’s Main Job Status | Not working | 68 | 0 | 0 | 0 | 0 | 0 | 144 |
| 0 | 26 | 4.7 | 0 | 0.9 | 0.5 | 67 | |||
| Total | 68.2 | 26 | 4.7 | 0 | 0.9 | 0.5 | 211 | ||
| Working | Mother’s Main Job Status | Not working | 58 | 0.2 | 0 | 0 | 0 | 0 | 298 |
| 0 | 38 | 2.4 | 0.4 | 1 | 0.2 | 211 | |||
| Total | 58.3 | 38 | 2.4 | 0.4 | 1 | 0.2 | 509 | ||
| Total | Mother’s Main Job Status | Not working | 61 | 0.1 | 0 | 0 | 0 | 0 | 442 |
| 0 | 34 | 3.1 | 0.3 | 1 | 0.3 | 278 | |||
| Total | 61.2 | 34 | 3.1 | 0.3 | 1 | 0.3 | 720 | ||
| Source: Research Findings 2015 (processed) | |||||||||
Table 13: Proportion of Respondents by Mother’s Main Job Status and Mother’s Income.
Before the estimation model of socio-economic factors influence the probability of child labor further analysis it is necessary to test the validity of the results of these estimates. The testing process the results of this estimation is done by testing overall (overall test), and partial testing (partial test) [63]. Overall test with which to view the omnibus Tests of Model Coefficient, while the partial testing (partial test) is done by looking at the effect of variable.
Output of the omnibus test in Table 14 seen that sig=0.000 which is less than 0.05. With the assurance level of 95 percent (α=5 per cent), there is at least one independent variables that affect the dependent variable (dependent). It can be concluded that the model can be used for further analysis.
| Chi-square | df | Sig. | |
|---|---|---|---|
| Step | 617.983 | 14 | .000 |
| Block | 617.983 | 14 | .000 |
| Model | 617.983 | 14 | .000 |
| Source: Research Findings 2015 (SPSS output 20) | |||
Table 14: Overall Test Omnibus Tests of Model Coefficients.
The estimation results of logistic regression analysis in Table 15. Using the Wald test, Significance, and Old Ratios explain the influence of independent variables on the dependent variable. In the column Sig. inform the significant effect of the independent variable on the dependent variable. Significant effect occurs if the value sig <0.05. Estimation Results Table 4. With the Wald test explained that the column sig influence of independent variables on the dependent variable of 0000, where the value is sig <0.05. This means that independent variables simultaneously affect the dependent variable. Column Exp (B) informs the kind of influence on the variables that influence significantly and if the value is greater than one, then the probability for a child to work is greater. Exp (B) in Table 16. amounted to 2.412 means that the probability of child labor is greater than 2.412 times the children who are not working.
| B | S.E. | Wald | df | Sig. | Exp (B) | |
|---|---|---|---|---|---|---|
| Constant | .881 | .082 | 115.668 | 1 | .000 | 2.412 |
| Source: Research Findings 2015 (SPSS output 20) | ||||||
Table 15: Testing Results Regression Analysis Step 0.
Table 16 explain the feasibility test model (Hosmer Lemeshow test) where the test results show sig 0000, with the assurance level of 95 per cent, (α=5 percent) believed that the logistic regression model used has been quite able to explain data/appropriate.
| Chi-square | df | Sig. |
|---|---|---|
| 32.884 | 8 | .000 |
| Source: Research Findings 2015 (SPSS output 20) | ||
Table 16: Hosmer dan Lemeshow Tes.
Value Nagelkerke R Square shows the coefficient of determination. Table 17 informs that the value Nagelkerke R Square is 0.830, which means that 83.0 percent of the influence of all independent variables on the dependent variable, while the remaining 17.0 percent influenced by other variables outside the model.
| Observed | Prediksi | ||||
|---|---|---|---|---|---|
| Child | Percentage Correct | ||||
| Not working | Working | ||||
| Step 1 | Anak | Not working | 195 | 16 | 92.4 |
| Working | 33 | 476 | 93.5 | ||
| Overall Percentage | 93.2 | ||||
| Source: Research Findings 2015 (SPSS output 20) | |||||
Table 17: Table Classification.
Table 17 explains that the logistic model used was quite good, being able to guess correctly 93.2 percent of conditions.
Effect of Socio Economic Factors against Child Labour
In this section will be discussed, namely: socio-economic factors (father's education, mother's education, children's education, father’s income, mother’s income, father's main job status, mother’s main job status) against child labor.
Influence Factor on Probability Education Parent Child Labour
Based on estimates by comparing the statistical value and the Wald chi-square value (Sig.) In Table 18, Parental education are not significant at α=5 percent level affect the probability of child labor. The estimation results indicate that there is no difference (no difference) the probability of child labor among parental education graduated from high school with a high-school dropout due partly to mostly elderly people (both graduated from high school with a high-school dropout) only worked informal sector and there is even a does not work. Although the parents realize that the responsibility of making a living is their duty, but because of their time to take care of the children consumed relative to work in the informal sector can not expressly forbid their children to work.
| Variable | B | S.E. | Wald | df | Sig. | Exp(B) |
|---|---|---|---|---|---|---|
| Father’s education | -0.091 | 0.582 | 0.024 | 1 | 0.876 | 0.913 |
| Mother’s education | 0.149 | 0.665 | 0.05 | 1 | 0.822 | 1.161 |
| Children’s education | -1.536 | 0.456 | 11.358 | 1 | 0.001 | 0.215 |
| Father’s income | -0.002 | 0.017 | 0.009 | 1 | 0.923 | 0.998 |
| Mother’s income | -0.078 | 0.062 | 1.581 | 1 | 0.209 | 0.925 |
| Father’s Main Job Status | 1.066 | 0.409 | 6.793 | 1 | 0.009 | 2.904 |
| Mother’s Main Job Status | 1.107 | 0.459 | 5.809 | 1 | 0.016 | 3.024 |
| Constant | -6.788 | 1.218 | 31.084 | 1 | 0 | 0.001 |
| Source: Research Findings 2015 (SPSS output 20) | ||||||
Table 18: Model Estimation Results Effect of Socio Economic Factors Working Against Children Probability.
In Table 18 value B shows the father's education variable coefficient is negative. Means, the father graduated from high school education have a lower probability of child labor as compared with the father did not finish high school education. Coefficient values of -0091, which means the value Odd Ratio/Exp (- 0091)=0.913, shows the comparison of the probability of child labor by the father graduated from high school education compared to the probability of child labor by father's education is not completed high school, which is 0.913. Thus it can be stated that the probability of child labor by the father graduated from high school education only 0.913 times that the father did not finish high school education.
In this study with respect to the father's education variable coefficients are negative, then the father's education to the educational level of parents (father graduated from high school) is higher than the tendency of children to work is lower. It is due to that father educated (high school graduation) know the value of education so that their child will not be motivated to work and focus on school.
In connection with the value of the variable coefficient B shows positive sign of maternal education (Table 18) to the educational level of parents (mother graduated from high school) the higher the tendency of children to work is higher. With the value of the coefficient for 0149, which means the value Odd Ratio/Exp (0149)=1161, shows the comparison of the probability of child labor by mothers completed high school education compared to the probability of child labor by mother's education is not completed high school, which is 1,161. Thus it can be stated that the probability of child labor by mother's education graduated from high school with 1,161 times the mother did not finish high school education.
In this study that the tendency of children to work more with the mother's education graduated from high school. This happens due to them based on Table 18. that the working mothers of 41.5 percent, so when mom works more work outside, then the probability of child labor becomes higher. Where mothers whose role is to take care of the household and educating children, with unlimited working time, the relative time is already taken up for work.
Probability Influence Children Education against Child Labour
Based on estimates by comparing the statistical value and the Wald chi-square value (Sig.) In Table 18. children's education significantly on the level of α=5 per cent affect the probability of child labor. The estimation results indicate that children who are still studying (in school) has a smaller probability to work. This condition is relatively acceptable for children who are in school most of the time is spent on learning at school and at home.
Table 18 shows the value of children's education variable coefficient is negative. Means, with children's education (schools) have a lower probability of working children compared to children's education (no school). With the value of the coefficient of -1,536, which means the value Odd Ratio/Exp (-1536)=0.215, shows the comparison of the probability of child labor (school) than the probability of a child's education (no school), ie 0.215. Thus the probability that children attending child labor is of only 0.215 times than children who do not attend school. This finding is consistent with research Ersado (2003).
Influence of Probability Income Parents against Child Labour
Based on estimates by comparing the statistical value and the Wald chi-square value (Sig.) Table 18. parents' income is not significant at α=5 percent level affect the probability of child labor. The estimation results indicate that there is no difference (no difference) the probability of children in child labor in any increase in revenue father. This is caused by some of the parents have worked in the informal sector and may not even work. Based on the results of the study show that the father worked in the informal sector amounted to 51.4 percent and a mother who does not work by 41.8 percent.
Table 18 shows the value of the income variable coefficient is negative father. That is, the lower the income of father has a higher probability of child labor. With the value of the coefficient of -0002, which means the value Odd Ratio/Exp (-0002)=, show any increase in revenue father, then the probability of child labor is lower by 0998 times.
Table 18. B shows the value of the income variable coefficient is negative mothers. That is, the higher the income of the mother has a lower probability of child labor. With the value of the coefficient of -0.078, which means the value Odd Ratio/Exp (-0.078)=0.925, showing every mother revenue increase, the probability of child labor is lower by 0.925.
Effect of Main Employment Status father Probability against Child Labour
Based on estimates by comparing the statistical value and the Wald chi-square value (Sig.) In Table 18. The father's main job status is significant at α=5 percent level affects the probability of child labor. The estimation results indicate that the main employment status of parents in the informal sector have a smaller probability of a child to work. This condition is relatively acceptable for the father's main employment status in the informal sector is greater than the father's main job status in the formal sector.
Job Status in the Formal Sector
Table 18 B shows the value of the variable coefficient father's job status is positive. Means, with the main employment status of the father (informal sector) have a higher probability of child labor as compared with the father's job status (formal). With the value of coefficient of 1,066, which means the value Odd Ratio/Exp. (1066)=, shows the comparison of the probability of the child with the father's job status (informal sector) workers' children than the probability of child labor by father's job status (formal) ie 2,904. Thus it can be stated that the probability of the child with the father's work status (working in the informal sector) to work 2,904 times compared to father's work status (working in the formal sector). This finding is consistent with research from Hardius (2002).
Effect of Main Employment Status Mothers against Child Labour Probability
Based on estimates by comparing the statistical value and the Wald chi-square value (Sig.) In Table 18 mother's employment status main significant at α=5 percent level affect the probability of child labor. The estimation results indicate that the main employment status of working mothers have a smaller probability of child labor. This condition is relatively acceptable for the main employment status of working mothers, the majority of the time is up tersita to work.
Based on Table 18. the value of the variable coefficient B shows the maternal employment status is positive. Means, with the employment status of mothers (working) have a higher probability of child labor as compared to maternal employment status (not working). With the value of coefficient of 1,107, which means the value Odd Ratio/Exp (1107)=3024 shows the probability ratio of children to working with maternal employment status (working) compared with the employment status of mothers (did not work) is 3,024. Thus it can be stated that the probability of a child to work with maternal employment status (working) 3,024 times compared maternal employment status (not working). This finding is consistent with research from Hardius.
Based on Table 18 Marginal effect on the results of the study the factors affecting child labor are:
Socio-economic factor’s (Children’s Education, Father’s Main Job Status, Mother’s Main Job Status).
Factors Children Education shows the 0.01 level and value -.037789 marginal effect, meaning that the amount of influence the probability of a child's education on child labor for -0.0377891 or -3.77891 percent.
Factors Father’s main job status showed the significance level of 0.16 and the value of the marginal effect of 0.0449683, meaning that the magnitude of the probability of employment status father's influence on child labor 0.0449683 or 4.49683 percent.
Factors mother's main job status indicates the significance level of 0.09 and the value of the marginal effect of 0.0348505, meaning that the amount of influence the probability of mother’s major job Status to child labor or 3.48505 percent.
Of the three socio-economic factors influence child labor more influential is the father's main job status at 4.49683 percent.
Based on analysis of descriptive and inferential problems of factors that affect child labor among others are:
1. The socio-economic factor’s influence the value of child labor with marginal effects influence the father's main job status of child labor is 4.49683 percent.
2. Child educational factors influence the probability of child labor in the city of Palembang significantly, where the greater the number of children attending school, the smaller the probability of child labor.
3. Factor income of parents (father and mother) affect the probability of child labor in the city of Palembang is not significant, because when connected to main employment status of parents mostly work in the informal sector may not even work so that the income received family also has not been sufficient to meet the needs of the family.
4. Factors father's main job status affect the probability of child labor in the city of Palembang significantly, meaning that the higher a father who worked in the informal sector, the probability of getting a bit of child labor. But in this study because a father who worked mostly in the informal sector so that income is also low, the children are forced to work to supplement the family income.
5. The main factor of maternal employment status affect the probability of child labor in the city of Palembang significantly, more and more mothers are working, then the probability of child labor is getting less.
1. For the Government, the public, and parents should support each other is because of these three elements played an important role against the entry of children into the labor market.
2. The government should plan a long-term program and give priority to minimize harmful child labor especially the child himself both physically and psychologically.
3. The government should minimize child labor by freeing the child so that they can better participate in education and providing scholarships for children who excel to motivate other children to study harder.
4. This study has limitations that need to be made more specific studies both from a research model as well as in-depth analysis.
Copyright © 2026 Research and Reviews, All Rights Reserved