ISSN: 1204-5357
ISSN: 1204-5357
Deepankar Roy*
Assistant Professor, National Institute of Bank Management, Information Technology, Pune, Maharashtra, India,
Amarendra Sahoo
Assistant Professor, National Institute of Bank Management, Information Technology, Pune, Maharashtra, India
Visit for more related articles at Journal of Internet Banking and Commerce
An efficient payment system acts as an enabler for speeding up liquidity flow in the economy, apart from ensuring proper utilization of limited resources it also eliminates systemic risks. Flow of funds across borders demands the security, integrity of the payment system and the harmonization of the systems in the related countries. The paper dwells with the need to modernize the payment system and migrate from paper-based to electronic mode of payment system to enhance efficiency and save cost. It delves in to the core of payment systems in the select countries with a comparative analysis. Benchmarking against the BIS core principles of Systemically Important Payment Systems revised as core principles of Financial Markets Infrastructure has been done to ensure convergence with the international best standards for Governance of Payment systems. The payment system of any country, though advanced and sophisticated, does face various risks, viz. bank failures, frauds, counter-party failures, etc. Such aberrations could trigger a chain-reaction that might ultimately result in disruption and distrust of the payment system. For example, if one large payment transaction cannot be settled, it disturbs other transactions leading to failure of the institutions involved in the process ultimately upsetting the entire payment system in the country. Such systematic and cascading breakdown of the payment system can hinder efficacy of monetary policy and badly impact confidence in the financial system. Minimization of systemic risk is therefore a critical challenge facing the regulators. Like in any ambitious economy, in India too, the fast advances in information technology, changes in regulatory framework, setting up of new institutions have aided to the rise of new payment practices, products and delivery channels for small as well as large value, and urgent payments. The paper shows areas for improvement in the efficiency in existing payment systems in India and the other countries especially in regard to the liquidity risk, operational risks, access criterion, transparency etc. In the end, the paper makes a modest attempt to identify opportunities and challenges for India. Numerous major changes in the payment system would take place at a quicker pace as e-commerce becomes more prevalent in the economic activities in the country.
Momentum; Idiosyncratic Volatility; Gross Domestic Product (GDP); Bond Yield; Liquidity; Emerging Economies
Price momentum is a phenomenon which is widely reported in different markets, different time frames and in almost all asset classes. Initially reported by Jegadeesh and Titman [1] it is found to be persistent across asset classes, markets and different geographies. As per rational theories of finance an investor is compensated for the level of risk taken in the market. Market knows the best notion doesn’t agree with a notion of positive alpha. Even if a trading strategy earns a positive alpha in short run, it should not be consistent in long run. But momentum is an exception in this respect. Macroeconomists say that stock market is nothing but a lagged indicator of the macroeconomic conditions and growth prospects available in a country, so macroeconomic factors should explain any of the excess return phenomenon. Similarly market state is a factor which is systematic or a risk of non-diversifiable nature and hence it may affect the momentum return. Again growth factors of the individual companies with access to prudent management and non-substitutable resources provide sustained competitive advantage and can result in sustained stock market performance by a company. Similarly, changing choices and preferences of customers and investors can change the performance of stocks in negative manner also. What differentiates all these factors is the extent of influence and the time horizon for getting the effect on stock returns.
Jegadeesh and Titman [2] introduced momentum and profitability of momentum strategies to finance literature, which is still not, explained completely. Authors use industry, credit rating, liquidity as the measure for risk associated with momentum return. These studies use cross-sectional as well as time varying data in their study with different analysis technique and different procedure of test. Chen, Roll, and Ross [2] concluded macroeconomic variables explain variability in returns. Moskowitz and Grinblatt [3] investigated the relationship between industry returns and macroeconomic variables and concluded that the profitability of a momentum strategy is attributable primarily to momentum in industry factors. Grundy and Martin [4] say that individual stock- and industry- based momentum returns are distinct and separate phenomena. Behavioural theorists explain momentum as a result of slow diffusion of information in stock prices or under-reaction or individual investor attitude towards risk in different countries, selling the winners and holding the losers or disposition effect, loss aversion and bounded rationality.
The objective of the study is to examine sources of momentum profit with the help of macroeconomic and firm specific variables under different market states. The paper attempts to examine whether conditioning of the state of the market is important to the profitability of the momentum strategies. This analysis is carried out in three parts- analyses entire market irrespective of the market state, analyses up market state and down market state. GDP and bond yield as the represents the macroeconomic factors, while dividend yield, idiosyncratic volatility, liquidity and price-earnings ratio are chosen as proxies for the firm specific factors. The basic objective is to find the relative importance of the factors such as GDP, Bond yield, Dividend yield, idiosyncratic volatility, liquidity and price-earnings ratio.
There is no unified study that accounts the extent to which macroeconomic, market driven and firm-specific factors drive momentum profits. The motivation to carry out this study in the Indian market emanates from a host of factors. The liberalization of Indian economy has captured the interest of a wide array of foreign institutional investors and foreign portfolio managers to invest in the Indian market. Increased numbers of market participants boost information efficiency in the market. At the same time market participants come with their own behavioral patterns that are reflected in their trading and investment patterns. The active and continuous effort of regulators for improving the functioning of Indian markets has gathered renewed confidence in the minds of domestic and international investors as well. These seminal changes in the Indian market after opening of the economy, in 1991 have broadened research interests in comprehending the Indian market dynamics.
This study tries to find explanation of momentum with macroeconomic, market state, firm specific factors in the Indian market. This study examines sources of momentum profits in connection with the macroeconomic and firm specific variables under different market states. The findings of the study are useful for various participants in different manner as discussed: for individual investors it is helpful in determining the choice of stocks for their portfolio for a superior performance without incurring any cost on the investment advice as momentum strategy is based on publicly available data. For portfolio managers as well as institutional investors the findings are helpful in determining the most profitable formation as well as holding period for investment in Indian market.
The contributions of the study would broadly be three folded: (i) the outcomes of the study fill the void in the existing stocks of literature on momentum profit in the Indian equity market. (ii) the presence of momentum profits in Indian market may induce the investors to develop momentum investment strategies in the Indian equity market investment firms and traders may redesign their trading strategies so as to minimize the vulnerability, and (3) understanding of the drivers of momentum profits in the up market and down market states of the Indian market may help the market participants to devise their trading strategies under momentum investing.
Sources of Momentum
Miller [5] stated that stocks with short-sale constraints and high dispersion in opinion tend to be overvalued and create low subsequent returns. The author argued that short-sale constraints prohibit pessimistic traders from entering into the market, so it is only optimistic investors who keep trading that increase prices, leading to overvaluation. Overvaluation continues until the difference in opinion is narrowed and until investors realize the fact that the stock is overvalued and start selling their holdings. Miller's views on the impact of short-sale constraints and difference in opinion on stock valuation can be extended to scrutinize possible reasons to utilize momentum profits.
Barberis, Shleifer and Vishny [6] showed that investors face a conservatism bias and under-react to earnings and corporate news that lead to a positive short-run autocorrelation. While during trends of increasing prices, a positive signal leads to over-reaction and subsequent long-run negative auto-correlation. Investors were conservative and under-reacted to important information while adjusting their beliefs. The study has immense implications for explaining momentum returns with behavioral finance models.
Daniel, Hirshleifer and Subrahmanyam [7] introduced an alternative model based on overconfidence and self-attribution and suggested that over-reaction/overvaluation leads to momentum profits. The authors suggested that investors are overconfident about private information, and tend to overweight private information while under-reacting to public signals. Investors tend to overreact to prior information due to self-attribution. The over-reaction in prices is rectified in the long run when investors observe future news and realize their mistakes. So, increased overconfidence leads to momentum in short run, and to reversals in the long run. Research idea of the study is innovative and it should be tested with new data and in new context.
Hong and Stein [8] constructed a plausible model that delivers a unified account of asset-price continuations and reversals. Based on the processing time required for new information, authors divide the investors into two groups i.e. news watchers and momentum traders. By doing so authors state that the momentum strategy as put forward by Jegadeesh and Titman [1] should be most profitable among those stocks for which information moves most slowly across the investing public. To examine the phenomenon authors incorporate two proxies such as firm size and a stock's residual analyst coverage after controlling for size and for the rate of information diffusion. In the model prescribed by the author’s momentum traders are rational maximizers who make money on average and impose a negative externality on others by trading in small stocks having less analyst coverage in which information diffuses slowly. The authors concludes by reporting that the phenomenon of short-run continuation and long run reversals are more pronounced in stocks with small market capitalization and low-analyst-coverage where information diffuses more slowly. Long run overreaction to information that is initially private is observed than to public news announcements; and a relationship between momentum traders' horizons and the pattern of return autocorrelations needs to be further reexamined.
Lee and Swaminathan [9] examined the role of past trading volume as a link between momentum and value strategies. Data was obtained from three major sources. Price and trading volume data of all listed firms in the NYSE and AMEX was collected from CRSP; book to market value and return on equity was collected from Compustat database; and earnings forecasts and analysts coverage from I/B/E/S database. Their findings establish several important regularities about the role of trading volume in predicting cross-sectional returns. There were no significant price reversals through the third year following portfolio formation, which goes against the findings of Jegadish and Titman [1]. However, over Years 3 through 5, they find that initial winner portfolios significantly underperform initial loser portfolios. The common presumption of price momentum as a matter of under reaction gets refuted here, and it was stressed that at least a portion of the initial momentum gain is better characterized as an overreaction. Further, firms with high (low) past turnover ratios exhibit many glamour (value) characteristics, earn lower (higher) future returns, and have consistently more negative (positive) earnings surprises over the next eight quarters. Authors claimed that the magnitude and persistence of price momentum are predicted by past trading volume as well. Specifically, price momentum effects reverse over the next five years, and high (low) volume winners (losers) experience faster reversals. Collectively, their findings show that past volume helps to reconcile intermediate-horizon"under-reaction" and long-horizon"overreaction" effects.
Hong, Lim and Stein [10] extend the under-reaction hypothesis of Hong-Stein [8] which states additional momentum in stocks with slower information diffusion with an extended assumption. Firm size, analyst coverage and two proxies for transaction costs (share turnover and a dummy variable for the existence of listed options on a given stock) are used as variables in the study to examine the additional momentum in stocks. The data for the study comes from three primary sources i.e. the stock returns from CRSP monthly stocks combined file, the analyst coverage monthly data from the I/B/E/S historical summary file and the options-listing data from the Options Clearing Corporation. The authors establish three key results that (I) apart from the very smallest stocks, the profitability of momentum strategies declines sharply with firm size, (ii) holding size fixed momentum strategies work better among stocks with low analyst coverage and (iii) the effect of analyst coverage is greater for stocks that are past losers than for past winners.
Chen, Hong, and Stein [11] proposed that changes in ownership are intrinsically connected to momentum profits. The only issue that arises is that under any circumstance of disagreement, all stocks would be purchased by optimistic investors only. Miller's hypothesis holds true only when the number of pessimistic investors exceeds the number of optimistic investors. Alternatively, higher number of investors as compared to that of pessimistic investors leads to lower disagreement, which signifies that large number of optimistic investors will purchase and increase the prices. Ownership structure is a country dependent variable and is a significant determent of the existence, growth and profitability of Indian firms, so extending the idea in Indian equity market will give new insights.
Chordia and Shivakumar [12] analyzed the relative importance of common factors and firm-specific information as sources of momentum profits and showed that profits to momentum strategies could be explained by a set of lagged macroeconomic variables that are related to business cycles. The authors took monthly data of all stock listed in NYSE-AMEX from CRSP for a period spanning from 1926 to 1994. One-period-ahead return was modeled on lagged macroeconomic variables such as dividend yield, default spread, yield on three-month T-bills, and term structure spread. The parameters of the model were estimated each month, for each stock, using the returns of previous 60 months. For each month t, returns from each stock for month’s t-6 through t-1 were ranked into deciles portfolios based on their formation period returns. The portfolios were formed by weighting equally all firms and were ranked as winners (P10) and losers (P1). Using momentum strategy, long positions in portfolio P10 and short positions in portfolio P1 were held for the following six-month period, t through t + 5. The result showed that during the post-1951 period the payoffs to a momentum strategy were significantly positive, while the overall average momentum payoff for the entire period was insignificant. Further, momentum payoffs were positive only during non-January months, while they were significantly negative in January. The authors divided the sample into two economic environments: expansionary and recessionary periods and examined whether the profitability of momentum strategies is related to business cycles. When momentum portfolios were formed using raw returns, results showed that the predictive ability of past returns is restricted to the portion of returns that is predictable by macroeconomic variables. The results indicated that payoffs from momentum strategies based on stock-specific returns were insignificant and that industry momentum was found to be related to the macro-economy. However, the relationship between individual stock returns and the macro-economy was distinct and independent from that of the relationship between industry returns and the macro-economy.
Griffin et al. [13] study data of 40 countries to examine the relationship between momentum returns and macroeconomic risk and to investigate the sources (risk-based, behavior-based) of these momentum returns. Using monthly return data of all NYSE and AMEX stocks in United States and data for other 39 countries on the basis of correlations of momentum returns the authors examine interregional and intraregional relation between macroeconomic risk and momentum profit. It is observed that momentum profits are large and have weak co-movement among countries. Further, using the macroeconomic risk proxies like unexpected inflation, changes in expected inflation, term spread and changes in industrial production it is affirmed that momentum profits can’t be explained by macroeconomic factors. However, borrowing the risk based factors from the Chordia and Shivakumar study such as dividend yield on the market, the term spread, yield on the three-month T-bill and the default spread, authors conclude that momentum profit and market movement has no correlation and the extent of momentum profit is slightly higher during high growth in GDP whereas it remains large and positive in all other states. By measuring the performance of stocks in 60 months after investment period the authors find that momentum profits reverse soon after investment period and become negative. Over long horizons reversal pattern is more compatible with behavioral explanations. The authors contend that macro factors do not explain the momentum factor but behavioral factors explain the return reversal; so if the two factors of risk based and behavioral based are combined and the individual and interaction effect are seen then it should explain entire phenomenon of return continuation and reversal.
Cooper, Gutierrez, and Hameed [14] use NYSE and AMEX stocks listed on the CRSP monthly file from January 1926 to December 1995 to test whether overreaction is the source of price momentum and to test whether state of the market plays a role in determining the profitability of momentum strategy. Two states are defined in the study based on past three years market return, where market state is up when the lagged three-year market return is non-negative and market state is down when the three-year lagged market return is negative. The authors observe that the state of the market has a clear and dramatic impact on the profits to momentum strategies1. Short-run momentum profits exclusively follow UP states and there is a significant long-run reversal following DOWN states as the market eventually corrects the mispricing. A six-month momentum portfolio is profitable only following periods of market gains (Up market states), and momentum profits increase as the lagged market return increases. Significant long-run reversal is observed in the down states without any initial momentum which indicates that long-run reversal is not solely due to the corrections of prior momentum. The study asserts that momentum profits are reversed in the long-run, as predicted by the overreaction theories. Thus lagged return of the market state is the type of conditioning information relevant for predicting the profitability of the momentum strategies. The way in which market state is defined in the study can be criticized on the basis of the practice followed by investors in the market. The rationale behind choosing time period to decide the state of the market may be examined in line with portfolio formation period used in the momentum strategy.
Zhang [15] used proxies like firm size and age, leverage, cash flow volatility; analysts forecast dispersion and return volatility to capture information uncertainty variables. The study showed that higher levels of information uncertainty causes relatively low future stock returns after bad news and higher returns after good news, revealing that uncertainty reduces the incorporation of information in stock prices. Information uncertainty and segregation of news into good and bad news is a tricky issue in case of momentum strategy as it is a long-short strategy (long on winners and short on losers).
Arena et al. [16] used a sample of common stocks traded on the NYSE, Amex or Nasdaq during 1965-2002 to examine the relationship between price momentum and idiosyncratic volatility. The authors argue that well-known anomalies, such as the small-firm effect and the value effect, are not observed after the sample periods examined by the studies that initially identify these anomalies. Idiosyncratic volatility represents proxy for firm-specific information and poses important limits to arbitrage as stocks with less idiosyncratic risk can be easily arbitraged whereas high idiosyncratic volatility poses limits to arbitrage. The study established positive and statistically significant relation between momentum returns and idiosyncratic volatility. Stocks with higher idiosyncratic volatility display greater momentum than do stocks with lower idiosyncratic volatility and the relation is primarily driven by high idiosyncratic volatility losers. Addition of information asymmetry to rational theory explains momentum profits more clearly as stocks with higher information asymmetry are observed to have greater momentum and reversal. Idiosyncratic volatility is an important reason of momentum profits persistence and even its increase over time. The authors concluded that the effect of idiosyncratic volatility on momentum is not subsumed by size, price, turnover, beta, price delay or financial distress risk.
Chen and Zhao [17] investigated the role of informed trading and information uncertainty in determining price momentum. They tested the effect of information uncertainty under various levels of informed trading and established that information uncertainty has a limited role in generating momentum returns. High-uncertainty stocks with high probability of information-based trading (PIN) exhibited price continuations, while high-uncertainty stocks did not exhibit significant momentum returns that had low PIN. Three information uncertainty measures were used, namely: analyst; firm size; and firm age. Data on stock returns was obtained from sources like CRSP and AMEX; analyst coverage was obtained from I/B/E/S and PIN estimate was obtained from Easley [18]. The period of study was from 1983 to 2004. The authors used Fama-French [19] and Carhart [20] four-factor model for their study. The result showed that price momentum was absent for low PIN portfolios, however, it got stronger when moving from medium to high PIN portfolio, confirming that informed trading played an important role in driving momentum returns. Results also showed that the informed trading effect on momentum was independent of information uncertainty. Informed trading effect on momentum was stronger than that of information uncertainty and that low uncertainty did not rule out momentum profits, as long as the stocks had high PIN. Informed trading effect on momentum was both independent of and stronger than the information uncertainty effect; and that the role played by information uncertainty was only limited to high PIN stocks. They also supported the gradual-information-diffusion model, in which private information diffuses gradually across news-watchers, causing price momentum. While the profitability of the relative-strength portfolios is not disputed, there is still a lot of controversy as to why these abnormal returns occur. Based on extensive literature survey done in previous session, it is observed that there is a lack of studies that examines the major factors driving momentum profit.
Sarwar and Muradoglu [21] investigated the existence of momentum returns while pricing for risk factors. The study used Fama and French’s factors for analyzing cross sectional variations and the macroeconomic risk factors stated by Chordia and Shivakumar [12] to carry on the time series variations. The sample consisted of all the stocks listed in AMEX, NYSE and NASDAQ during the period 1926-2005. Finally, the sample comprised of 22,277 stocks over 960 months. Initially, empirical investigation was conducted on the total sample period and then narrowed down to 10 year sub-periods (to examine variations in momentum returns through the different sub-periods). Raw momentum returns were measured using Jegadeesh and Titman’s (1993) method. Stocks were selected on the basis of returns of the past four quarters (i.e. 3rd, 6th, 9th and 12th month). The stock returns of individual stocks were divided into-risk premiums and an idiosyncratic component unexplained by risk factors. Alternative momentum strategies were formed by estimating parameters of each individual stock using a 60-month window and 24 observations.
Regression revealed positive, significant momentum returns for the entire period i.e. 1963-1989. A high momentum return was evidenced during the period 1946-1995, while it was found to be low during the pre-1950s and post 1995s. The returns were high when there was a rise in the US stock markets and low during falling markets (as established in previous studies [22].
Park and Kim [23] used monthly return data of fourteen countries to identify the sources of momentum profits. The results supported the risk based explanation for momentum profit. All the risk based as well as macroeconomic factors and their individual and collective impact needs to be identified. The interaction of risk based and macroeconomic variables with market states is another interesting area to be identified and analyzed in Indian market context.
Pyo and Shin [24] analyzed the relationship between momentum returns and idiosyncratic volatility in Korean stock market and found that systematic factors don’t explain momentum profits. Momentum returns are higher for high idiosyncratic volatility stocks prominently among high idiosyncratic volatility winner stocks. It is interesting to see the impact of idiosyncratic volatility in Indian market context.
Geczy and Samonov [25] used the data of security prices starting from 1801 and found a negative correlation between momentum beta and new market direction at the start of a new market state. The authors observed a relationship between the riskiness of momentum portfolio, excess return provided by momentum investing and the duration of a market state (Up/Down) or unidirectional market. There is a positive correlation between the riskiness of momentum investing and duration of a market state which contributes positively unless market changes its direction and this high beta exposure results into adverse returns once market changes its direction. The authors suggest using dynamic hedging by momentum investors in each market state. The way in which market sate is defined and used in the study is debatable, as when an investor invests in market he is interested in the percentage return for his holding period rather than the direction of the market. If the aggregate holding period return is positive the investor gets the utility maximization of his investment irrespective of the direction of the market.
Objectives and Hypothesis Development
This study examines the effect of firm specific, macroeconomic and market driven factors on momentum profit. The following hypotheses have been developed from the literature reviewed. H1: Macroeconomic factors explain momentum profit.
H1a: GDP significantly explains momentum profit in the Indian market.
H1b: Bond yield significantly explains momentum profit in the Indian market.
H2: Firm specific factors explain momentum profit.
H2a: Dividend yield significantly explains momentum profit in the Indian market.
H2b: Liquidity significantly explains momentum profit in the Indian market.
H2c: Volatility significantly explains momentum profit in the Indian market.
H2d: Price to Earnings significantly explains momentum profit in the Indian market.
The above hypotheses are tested first irrespective of the market states, second for up market state and third for down market state.
Investment management is one of the most important areas of financial economics. Different asset pricing models are at the core of investment management. There are two approaches to portfolio management i.e. passive and active. The study uses active portfolio management style in which the portfolio is balanced at a regular interval and held for different time period based on the investment style. The study is empirical and conclusive in nature, which can be justified broadly under following grounds. Firstly, as the information needed is clearly defined, research process is formal and structured and the sample selected is large and representative enough to represent the population. Secondly, the study is trying to find out the conclusive evidence by testing specific hypothesis and examining relationship among the variables in hand. Thirdly, the findings of the study can be used as input into strategic decision making and investing for the momentum investors in the Indian Market.
Data and Its Sources
The study is based on the secondary data, which is obtained from diversified sources. The monthly data on individual stock is obtained from national stock exchange (NSE) of India for a period of 20 years (April, 1995-March 2015). The study has made use of macroeconomic data such as on GDP2 and bond yield, which are obtained from Reserve Bank of India (RBI) website. Further, data on market driven factors such as market state3 and market liquidity4 and data on firm specific factors such as market capitalization and trading volume of stocks are obtained from the NSE website. The dividend yield, price to earnings ratio data is obtained from CMIE prowess database and idiosyncratic volatility which is used in the study is estimated from the market level data and the stock specific information by fitting the one factor CAPM model.
Variables Used/Constructed
The following variables are used in the study. The sub section describes how the variables are constructed and used in the study.
Dependent Variable: Portfolio construction and Momentum profit:All listed and permitted companies in National Stock Exchange (NSE) for a time period spanning across 20 years (April, 1995-March 2015) are used in the study. Monthly closing prices of stocks are used to calculate returns and are ranked on the basis of monthly returns. Aggregated returns in last 3, 6, 9, 12 months are used for ranking the stocks in 10 portfolios. The best performing stocks are set aside as the winners portfolio and the worst performing stocks are set aside as losers portfolio. Portfolios are equally weighted. Momentum strategy follows buying the winners and selling the losers; a zero cost momentum portfolio is held for next 3, 6, 9, 12 months as followed in Jegadish and Titman [1]. The study reports momentum profit (By buying winner portfolio and selling loser portfolio) for investing in Indian stocks over the sample period for 16 strategies (4x4).
Independent Variables: Macroeconomic factors: Two major macroeconomic factors are used in this study. The details of construction are presented hereunder:
GDP: Quarterly GDP data is taken directly from RBI for the study period starting from 4th quarter of 1995.
Bond yield: A proxy is used for bond yield which is computed from Treasury bill rates on monthly basis, which is obtained from RBI. While calculating monthly Treasury bill rate, 91-days Treasury bills weekly auctioned rates are averaged for a successive period of 4 weeks.
Firm specific factors: Firm specific factors such as size, liquidity, volume, volatility are used in the study. First three factors are using proxies and the related information is obtained from the Center for Monitoring Indian Economy (CMIE) Prowess database. The volatility is realized from fitting Hong and Stein models and portfolio specific volatility models respectively. The details of construction are presented hereunder:
Size: Market Capitalization5 is used as proxy to measure the size of the firm, which is represented by total market value of all of a company's outstanding shares in rupee terms. Natural logarithm of market capitalization is used as a control variable in the study for representing the size effect.
Liquidity: Total traded volume of each stock is used as a proxy for liquidity of the individual firm. While computing each stocks monthly trading volume, a sum of total traded volume of the stock for that month is taken into account.
Dividend yield (Divyield): This is a ratio between quarterly dividends of the sample firm’s divided by its corresponding current market price. Individual firms dividend yield are aggregated on portfolio level to find the dividend yield of the portfolio of the respective months of the study period. Data is obtained from CMIE Prowess data base.
Price to earnings ratio: The quarterly price to earnings ratio is directly obtained from the CMIE Prowess data base. This quarterly PE ratio is match up with base data set of the monthly stock return series for each of the firm. The PE ratio for each month is represented by PE ratio of the corresponding quarter.
Volatility: Idiosyncratic Volatility of stocks in the portfolio is used as a proxy for volatility. While constructing this major, market model of one factor is used. Idiosyncratic volatility measured by fitting the CAPM equation of excess return. It is aggregated on portfolio basis.
Control Variable: Market state is computed on the basis of last three months return of the broad based index (BSE Sensex). The rationale of using BSE Sensex as broad base Index for the Indian equity market emanates from the fact that there is no other Index available for the corresponding study period and this index represents the majorly state of Indian stock market as it is the oldest index and has long duration of data availability.
Market up state: Three months returns of market index are calculated and are aggregated together. If the sum is positive, market state is up.
Market down state: Three months returns of market index are calculated and are aggregated together. If the sum is negative, market state is down.
Multiple regression can be used for prediction and causal inference. In a causal analysis if the relationship between the dependent variable and independent variable is hypothesized from literature review or existing theories then the aim of the regression model is to find the affect and magnitude of independent variable on dependent variable. Regression analysis fulfills the criteria so it is used as the preferred methodology. The following multiple regression is used to examine the extent of impact of macro, and firm specific factors on momentum profits under different market states.
Momentum Profit Irrespective of the Market States
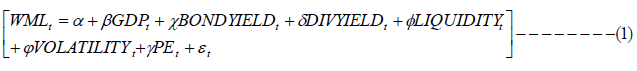
To explain the factors influencing the momentum behavior, regression model (eqn. 1) was estimated. The dependent variable used in the study was the portfolio return difference between winners and losers (WML) whereas natural logarithm of Gross Domestic Product (GDP), bond yield, liquidity, and idiosyncratic volatility (volatility) were the explanatory variables used in the full regression model. Above mentioned regression model is estimated separately for all the 16 strategies across 3, 6, 9 and 12 month holding and 3, 6, 9 and 12 month formation periods. Panel A of Table 1 reports the estimates of 3-3, 3-6, 3- 9 and 3-12 (formation- holding) strategies. The comparison of adjusted R-square values suggests that the explanatory power decreases with increase in holding periods. The macroeconomic factors such as GDP and bond yield significantly explains the momentum profit in longer holding periods of 9 and 12 months. Thus H1a and H1b both hold true in the longer run that means in the longer horizon of formation and holding periods only GDP and Bond yield significantly explain momentum profit in the Indian equity market. While among the firm specific factors, idiosyncratic volatility is observed to be one of the statistically significant and positive sources of momentum profit irrespective of holding period horizons. This highlights the fact that the idiosyncratic volatility is one of the most important firm specific factors determining the momentum returns. However dividend yield is also significantly determining the momentum profits for 3, 6, and 9 month holding periods only. It is also observed that liquidity influence momentum returns only in long term (9 and 12 months) holding periods. Thus,H2a and H2c hold true in most of the cases (except 12 months) and H2b holds true only for long run that means volatility liquidity and dividend yield significantly explain momentum profit in the Indian equity market.
| Holding | Intercept | GDP | Bondyield | DivYield | Liquidity | PE | Volatility | Adj R-sq |
|---|---|---|---|---|---|---|---|---|
| Panel A: 3 month formation Period | ||||||||
| 3 Month | 21.88 | 0.01 | 0.86 | -8.05* | 0.01 | -0.44 | 1.31*** | 0.19 |
| (0.89) | (0.66) | (0.94) | (-1.81) | (-0.29) | (-0.56) | (4.60) | ||
| 6 Month | 36.89 | 0.11 | -0.44 | -10.51* | -0.01 | -0.54 | 1.30*** | 0.11 |
| (1.14) | (1.63) | (-0.37) | (-1.81) | (-0.91) | (-0.53) | (3.50) | ||
| 9 Month | 82.57*** | 0.01*** | -3.42*** | -14.96*** | -0.01*** | -1.29 | 0.92*** | 0.08 |
| (2.18) | (3) | (-2.43) | (-2.19) | (-2.22) | (-1.08) | (2.10) | ||
| 12 Month | 67.19 | 0.11*** | -4.86*** | -7.75 | -0.01*** | -0.70 | 0.84** | 0.08 |
| (1.62) | (4.13) | (-3.17) | (-1.04) | (-2.58) | (-0.53) | (1.76) | ||
| Panel B: 6 month formation Period | ||||||||
| 3 Month | -6.37 | 0.01 | -0.11 | -1.23 | 0.00 | 0.18 | 1.22*** | 0.10 |
| (-0.26) | (1.38) | (-0.12) | (-0.28) | (0.13) | (0.23) | (4.38) | ||
| 6 Month | -31.59 | 0.01*** | -2.29** | 4.85 | 0.00 | 1.40 | 1.50*** | 0.11 |
| (-0.97) | (2.58) | (-1.91) | (0.83) | (-0.17) | (1.36) | (4.01) | ||
| 9 Month | -18.06 | 0.01*** | -5.23*** | 7.27 | 0.00 | 1.74* | 1.03*** | 0.13 |
| (-0.48) | (3.68) | (-3.75) | (1.07) | (-0.82) | (1.76) | (2.37) | ||
| 12 Month | -27.15 | 0.01*** | -6.55*** | 10.79 | 0.00 | 2.23* | 0.96** | 0.16 |
| (-0.63) | (4.4) | (-4.11) | (1.39) | (-1.11) | (1.64) | (1.94) | ||
| Panel C: 9 month formation Period | ||||||||
| 3 Month | 4.25 | 0.01** | -0.97 | -1.98 | 0.00 | 0.36 | 0.68*** | 0.03 |
| (0.18) | (1.9) | (-1.11) | (-0.47) | (-1.32) | (0.48) | (2.53) | ||
| 6 Month | -45.86 | 0.11*** | -2.93*** | 10.40* | 0.00 | 2.29*** | 0.96*** | 0.08 |
| (-1.37) | (2.69) | (-2.36) | (1.73) | (-0.68) | (2.17) | (2.50) | ||
| 9 Month | -46.09 | 0.11*** | -5.58*** | 14.29*** | 0.00 | 2.89*** | 0.67 | 0.15 |
| (-1.16) | (3.74) | (-3.78) | (1.99) | (-1.00) | (2.30) | (1.46) | ||
| 12 Month | -55.92 | 0.11*** | -7.44*** | 18.61*** | 0.00 | 3.55*** | 0.53 | 0.25 |
| (-1.36) | (5.04) | (-4.87) | (2.51) | (-1.53) | (2.73) | (1.11) | ||
| Panel D: 12 month formation Period | ||||||||
| 3 Month | -1.64 | 0.01 | -1.19 | 2.61 | 0.00 | 0.36 | 0.51*** | 0.01 |
| (-0.07) | (1.39) | (-1.44) | (0.65) | (-0.39) | (0.52) | (2.00) | ||
| 6 Month | -31.02 | 0.01*** | -3.41*** | 11.98*** | 0.00 | 1.78* | 0.47 | 0.08 |
| (-0.97) | (2.62) | (-2.87) | (2.08) | (-0.51) | (1.76) | (1.28) | ||
| 9 Month | -16.79 | 0.01*** | -6.90*** | 13.42*** | 0.00 | 2.04* | 0.15 | 0.22 |
| (-0.46) | (4.32) | (-5.09) | (2.04) | (-1.3) | (1.76) | (0.36) | ||
| 12 Month | -48.62 | 0.11*** | -7.95*** | 21.82*** | 0.01* | 3.23*** | 0.05 | 0.33 |
| (-1.3) | (5.77) | (-5.72) | (3.23) | (-1.73) | (2.72) | (0.12) | ||
Note: Figures in the parentheses show t-statistic values.*, ** and *** indicate 10%, 5% and 1% level of significance.
Table 1: Regression Estimate: Determinants of Momentum profit for all market states.
Panel B of the Table 1 shows the regression estimates for 6 month formation portfolio and different holding periods. The result here suggests that idiosyncratic volatility is one of the factors which significantly affect the momentum returns irrespective of the holding periods. While GDP and Bond yield are only significant for long holding periods beyond 6 months holding periods. This indicates that macro factors influence the momentum returns only in long term and idiosyncratic volatility as part of firm specific factor significantly determines the momentum profits both at shorter and longer holding period horizons. Panel C and D shows the regression estimates for 9 month and 12 months formation period portfolios across the holding periods The result here suggests that the GDP and bond yield estimates are mostly significant beyond 3 month holding periods but idiosyncratic volatility is observed to be statistically significant in near term holding periods and it turns into insignificant as holding period increases. It is also observed that PE estimates are positive and significant for long term formation and holding period portfolios. The explanatory power of the model also increases with the increase in the holding periods. Thus, this suggests that the macroeconomic factors play a very significant role in determining momentum profits in the loner horizon holding periods.
Findings suggest that the explanatory power of firm specific factors decreases with an increase in portfolio formation and holding periods whereas macroeconomic factors show their persistent influence on momentum returns beyond 3 month holding periods. H1a and H1b both hold true in the longer run that means in the longer horizon of formation and holding periods only GDP and Bond yield significantly explain momentum profit in the Indian equity market. Thus, H2a and H2c hold true in most of the cases (except 12 months) and H2b holds true only for long run that means volatility liquidity and dividend yield significantly explain momentum profit in the Indian equity market.
Explanation of Momentum Profit under Different Market States - Momentum Profit under up Market State
To examine the influence of market states on momentum profit, data was divided into two sets of market up and down states. Market state was defined as “up – state” when the sum of returns of 3 months is positive, and “down-market state” was defined when the sum of returns of 3 months is negative. For the finding the return broad based index of Bombay stock Exchange (BSE) Sensex is used in the study. Tables 2 and 3 below present the result of regression model for market up and market down state condition respectively. The results are shown into four panels A though D in Table 2. The aforesaid table shows the regression results of eqn. 6(1) across all the four formation and holding periods (16 strategies) in up market state. Panel A of Table 2 reports the estimates of 3-3, 3-6, 3-9 and 3-12 (holding-formation) strategies in market up state. The comparison of R-square indicates that maximum explanatory power of the model is attained for the 3 month holding period and it decreases as one increase the holding periods. The result here further suggests that GDP turns out to be one of the statistically significant and positive determinants of the momentum profits more or less beyond 3 month holding period horizon. However bond yield is observed to be negatively affecting the momentum profit at 1% level of significance only beyond 9 month holding period horizon. The idiosyncratic volatility is positive in direction which significantly determines momentum profits across the holding periods but monotonically decreases its significance moving ahead with the holing periods. However, liquidity as a firm specific factor negatively affects the momentum profits beyond 3 months holding periods at desired level of significance.
Panel B of Table 2 reports the regression estimates of eqn. 1 for 6-3, 6-6, 6-9 and 6-12 (holding-formation) period strategies. The result here further affirms that the Similar to Panel-A, idiosyncratic volatility positively and significantly determines the momentum returns up to 9 month holding period. Further it is interesting to note that while idiosyncratic volatility starts losing its relevance PE stands out to be a significant determinant of the momentum profit beyond 3 months portfolio holding periods. Further both of the macroeconomic factors under investigation, GDP and bond yield are significantly determining moment profits for beyond 3 month and beyond 6 months holding period respectively. This result consistently suggests that macroeconomic factors influence the momentum returns mostly in the longer term and effect of idiosyncratic volatility consistently decreases with the increase in holding periods. In the Panel C and D, GDP and bond yield estimates are mostly significant as holding period increases but idiosyncratic volatility becomes insignificant as holding period increases. The explanatory power of the model also increases with the increase in the holding periods. It was also observed that PE, liquidity and dividend yield estimates are significant for longer term formation and holding periods.
Table 2 suggests that under the firm specific factors, the explanatory power of idiosyncratic volatility decreases and that of dividend yield, PE and liquidity increases with increase in portfolio formation and holding periods. While macroeconomic factors show their persistent influence on momentum returns beyond 3 month horizon. Thus, H1a holds true in the longer run and H1b holds true in long run for few cases that means in the longer horizon of formation and holding periods. GDP significantly explains momentum profits whereas bond yield partially explains momentum profits in the Indian equity market during UP market state. Thus, H2c holds true for shorter formation and holding periods while,H2a, H2b and H2dhold true only in the long run. So volatility explains momentum profits in the short run whereas price to earnings, liquidity and dividend yield explains momentum profits in the long run in the Indian equity market during UP market state.
| Holding | Intercept | GDP | Bondyield | DivYield | Liquidity | PE | Volatility | Adj R-sq | |||||
|---|---|---|---|---|---|---|---|---|---|---|---|---|---|
| Panel A: 3 month formation Period | |||||||||||||
| 3 Month | 26.32 | 0.01 | 1.34 | -7.31 | 0.00 | -0.85 | 1.52*** | 0.27 | |||||
| (0.8) | (0.41) | (1.17) | (-1.35) | (0.76) | (-0.76) | (4.63) | |||||||
| 6 Month | -3.15 | 0.11 | 1.05 | -9.68 | 0.02* | 1.50 | 1.28*** | 0.25 | |||||
| (-0.08) | (1.44) | (0.73) | (-1.43) | (1.79) | (1.08) | (3.11) | |||||||
| 9 Month | 12.61 | 0.01* | 0.61 | -9.49 | 0.11** | 1.48 | 0.88** | 0.14 | |||||
| (0.26) | (1.65) | (0.36) | (-1.19) | (2.22) | (0.9) | (1.82) | |||||||
| 12 Month | 11.00 | 0.01*** | -1.31 | -3.74 | 0.10** | 1.41 | 0.59 | 0.10 | |||||
| (0.2) | (3.17) | (-0.7) | (-0.42) | (2.27) | (0.78) | (1.09) | |||||||
| Panel B: 6 month formation Period | |||||||||||||
| 3 Month | -20.70 | 0.01 | 0.73 | 2.49 | 0.00 | 0.68 | 1.28*** | 0.13 | |||||
| (-0.61) | (0.94) | (0.61) | (0.45) | (0.49) | (0.59) | (3.76) | |||||||
| 6 Month | -50.32 | 0.01** | -0.33 | 3.48 | 0.00 | 2.74*** | 1.21*** | 0.15 | |||||
| (-1.32) | (1.95) | (-0.25) | (0.56) | (1.12) | (2.14) | (3.21) | |||||||
| 9 Month | -37.95 | 0.01*** | -1.57 | 4.22 | 0.00 | 3.19*** | 0.66 | 0.09 | |||||
| (-0.84) | (2.18) | (-1) | (0.57) | (1.59) | (2.1) | (1.47) | |||||||
| 12 Month | -26.69 | 0.01*** | -2.93 | 2.83 | 0.01** | 3.21* | 0.21 | 0.15 | |||||
| (-0.5) | (3.22) | (-1.59) | (0.33) | (1.84) | (1.8) | (0.4) | |||||||
| Panel C: 9 month formation Period | |||||||||||||
| 3 Month | -12.88 | 0.11 | -0.10 | 1.63 | 0.11** | 1.01 | 0.72*** | 0.06 | |||||
| (-0.39) | (1.48) | (-0.09) | (0.3) | (1.82) | (0.92) | (2.2) | |||||||
| 6 Month | -63.53 | 0.01*** | -0.97 | 9.82 | 0.01** | 3.65*** | 0.63 | 0.11 | |||||
| (-1.65) | (2.14) | (-0.72) | (1.55) | (1.87) | (2.81) | (1.63) | |||||||
| 9 Month | -71.53 | 0.01*** | -2.40 | 14.35*** | 0.01*** | 4.66*** | 0.20 | 0.16 | |||||
| (-1.61) | (2.92) | (-1.56) | (1.98) | (2.21) | (3.13) | (0.45) | |||||||
| 12 Month | -98.51*** | 0.11*** | -3.86*** | 20.00*** | 0.01*** | 5.86*** | 0.00 | 0.27 | |||||
| (-2) | (4.44) | (-2.26) | (2.49) | (2.49) | (3.55) | (0.01) | |||||||
| Panel D: 12 month formation Period | |||||||||||||
| 3Month | -4.32 | 0.01 | -0.72 | 4.10 | 0.00 | 0.39 | 0.54 | 0.00 | |||||
| (-0.12) | (1.08) | (-0.58) | (0.71) | (0.79) | (0.33) | (1.53) | |||||||
| 6 Month | -29.15 | 0.01*** | -2.44 | 9.52 | 0.00 | 2.43 | 0.05 | 0.04 | |||||
| (-0.66) | (2.08) | (-1.59) | (1.32) | (1.51) | (1.64) | (0.13) | |||||||
| 9 Month | -14.61 | 0.01*** | -5.04*** | 10.50 | 0.01*** | 2.94** | -0.49 | 0.19 | |||||
| (-0.31) | (3.36) | (-3.04) | (1.34) | (2.51) | (1.83) | (-1.04) | |||||||
| 12 Month | -52.38 | 0.11*** | -6.13*** | 19.68*** | 0.11*** | 4.26*** | -0.65 | 0.36 | |||||
| (-1.09) | (5.45) | (-3.68) | (2.51) | (3.21) | (2.64) | (-1.35) | |||||||
Note: Figures in the parentheses show t-statistic values.*, ** and *** indicate 10%, 5% and 1% level of significance.
Table 2: Regression result under bullish market state.
Momentum profit under down market state
Table 3 shows the regression results of eqn. 1 across the 16 different strategies in market down state. Panel A, B, C, and D of Table 3 reports the estimates of 3-3, 3-6, 3-9 and 3-12 (formation- holding) strategies in market down state respectively.
| Intercept | GDP | Bondyield | DivYield | Liquidity | PE | Volatility | Adj R-sq | |
|---|---|---|---|---|---|---|---|---|
| Panel A: 3 month formation Period | ||||||||
| 3M | 39.90 | 0.01 | 0.48 | -11.79 | 0.00 | -0.93 | 0.94* | 0.13 |
| (1) | (0.01) | (0.26) | (-1.48) | (0.69) | (-0.79) | (1.77) | ||
| 6M | 18.94 | 0.01 | 0.33 | -0.47 | 0.00 | -0.89 | 1.00 | 0.03 |
| (0.33) | (0.4) | (0.12) | (-0.04) | (0.6) | (-0.53) | (1.31) | ||
| 9M | 128.00*** | 0.01*** | -6.73*** | -18.05 | 0.00 | -3.30* | 0.91 | 0.07 |
| (2.02) | (2.48) | (-2.28) | (-1.43) | (0.89) | (-1.78) | (1.07) | ||
| 12M | 96.52 | 0.01*** | -9.72*** | -10.26 | 0.00 | -1.61 | 1.59 | 0.08 |
| (1.31) | (2.6) | (-2.83) | (-0.7) | (0.96) | (-0.74) | (1.62) | ||
| Panel B: 6 month formation Period | ||||||||
| 3M | 20.07 | 0.01 | 0.12 | -7.20 | 0.00 | -1.05 | 0.97*** | 0.15 |
| (0.6) | (0.81) | (0.08) | (-1.08) | (0.76) | (-1.08) | (2.19) | ||
| 6M | -68.35 | 0.01 | -1.54 | 16.43 | 0.00 | 1.36 | 1.54** | 0.04 |
| (-1.13) | (1.32) | (-0.55) | (1.36) | (0.66) | (0.77) | (1.91) | ||
| 9M | -56.71 | 0.01*** | -6.17*** | 20.94 | 0.00 | 1.59 | 1.21 | 0.20 |
| (-0.88) | (2.63) | (-2.06) | (1.63) | (0.29) | (0.84) | (1.42) | ||
| 12M | -122.91 | 0.01*** | -7.82*** | 35.55*** | 0.00 | 3.81* | 1.90** | 0.26 |
| (-1.66) | (2.67) | (-2.26) | (2.4) | (0.38) | (1.75) | (1.92) | ||
| Panel C: 9 month formation Period | ||||||||
| 3M | 25.23 | 0.01 | -0.57 | -6.35 | 0.00 | -0.76 | 0.44 | 0.00 |
| (0.75) | (0.96) | (-0.37) | (-0.94) | (0.03) | (-0.77) | (0.99) | ||
| 6M | -81.28 | 0.01 | -1.77 | 20.65* | 0.00 | 2.00 | 1.03 | 0.03 |
| (-1.33) | (1.34) | (-0.62) | (1.69) | (0.55) | (1.12) | (1.26) | ||
| 9M | -80.53 | 0.12*** | -4.78 | 24.67* | 0.00 | 2.17 | 0.84 | 0.15 |
| (-1.14) | (2.24) | (-1.45) | (1.75) | (0.27) | (1.05) | (0.89) | ||
| 12M | -89.39 | 0.12*** | -7.79*** | 29.54*** | 0.00 | 3.08 | 0.98 | 0.24 |
| (-1.23) | (2.64) | (-2.31) | (2.04) | (0.18) | (1.45) | (1.01) | ||
| Panel D: 12 month formation Period | ||||||||
| 3M | 8.78 | 0.01 | -1.43 | -0.20 | 0.00 | -0.08 | 0.46 | 0.04 |
| (0.33) | (0.48) | (-1.15) | (-0.04) | (0.92) | (-0.1) | (1.3) | ||
| 6M | -81.05 | 0.01 | -2.41 | 23.11*** | 0.00 | 2.21 | 0.88 | 0.09 |
| (-1.55) | (1.12) | (-0.99) | (2.21) | (0.99) | (1.44) | (1.26) | ||
| 9M | -74.77 | 0.11*** | -6.63*** | 25.69*** | 0.00 | 2.29 | 0.93 | 0.25 |
| (-1.25) | (2.36) | (-2.38) | (2.16) | (0.77) | (1.31) | (1.17) | ||
| 12M | -111.31* | 0.11*** | -8.73*** | 34.55*** | 0.00 | 3.93*** | 1.18 | 0.35 |
| (-1.78) | (2.35) | (-3) | (2.77) | (1.28) | (2.15) | (1.42) | ||
Note: Figures in the parentheses show t-statistic values.*, ** and *** indicate 10%, 5% and 1% level of significance.
Table 3: Regression result under bearish market state.
The comparison of R-square across the holding periods indicates that maximum explanatory power of the model is attained for the 3 month holding period for 12 month holding period. Both the macroeconomic factors(GDP, bond yield) were found to be statistically significant determinants of momentum profits beyond 6 month holding period horizon. Bond yield has a negatively affect while GDP has a positive effect on momentum profits at 1% level of significance for the aforesaid holding horizon. The idiosyncratic volatility is positive in direction, which significantly determines momentum profits only for the 3 holding period. Examining strategies across 6 month, 9 month and 12 month formation periods, it was observed that the explanatory power of the model consistently increases with an increase in the tenure of the holding period for each formation period. The 12 month formation and 12 month holding period return was best explained compared to the other holding period returns by the macroeconomic and firm specific factors under investigation. Result across these strategies revealed macroeconomic factors, GDP and bond yield to be significant determinants of momentum profits at least at 5% level beyond 6 month holding periods. Overall results from the Table 3 indicate that only macroeconomic factors drive the momentum profit particularly under the market downturn periods when the portfolio holding as well as formation periods are more than 6 months. The results do not show any evidence of influence of firm specific factors on momentum profits.
Thus, H1a holds true in the longer run for few cases and H1b holds true in long run that means in the longer horizon of formation and holding periods GDP partially explain momentum profit whereas bond yield significantly explain momentum profits in the Indian equity market during down market state. Thus, H2c holds true for shorter formation and holding periods, and H2a holds true only for long run. This implies that volatility explains momentum profits in short run whereas dividend yield explains momentum profits in long run in the Indian equity market during down market state. In a nutshell, regression results considering the up and down market states affirm that the effect of firm specific factors decrease with increase in portfolio formation and holding periods. Whereas macroeconomic factors show their persistent influence on momentum returns beyond 3 month holding periods. Secondly, the regression analysis for market up state suggests that the explanatory power of idiosyncratic volatility decreases and that of dividend yield, PE and liquidity increases with increase in portfolio formation and holding periods. While macroeconomic factors show their persistent influence on momentum returns with increase in portfolio formation and holding periods beyond 3 month horizon. Thirdly, in a bearish market state, the regression analysis suggests that some of firm specific factors lackluster their impact and only the macroeconomic factors determine the momentum profits significantly in the longer run. Thus, during the market downturn period, macroeconomic impact shadows down the effect of most of the firm specific factors. However, dividend yield in the longer run and idiosyncratic volatility in the shorter run horizon explains momentum return to an extent. The results don’t conform with Lee and Swaminathan findings, but are in line with several other studies.
The study intended to examine the impact of macroeconomic, and firm specific factors in driving momentum profit under different market states. Irrespective of considering the market state, the results highlight that idiosyncratic volatility is one of the most important firm specific factors that significantly determine the momentum returns in the Indian market. However, its impact decreases with an increase in the formation and holding period. On the other hand, the effect of dividend yield, PE and liquidity on momentum profit increases with the advancement in portfolio formation and holding periods. While the macroeconomic factors considered show a persistent influence on momentum profits in Indian equity market. But during the market downturn period, macroeconomic impact shadows down the effect of most of the firm specific factors. However, dividend yield in the longer run and idiosyncratic volatility in the shorter run horizon explains momentum return to an extent under the market down turn periods.
There are significant implications for the practitioners and academic researchers. While investing for longer period, mangers/investors should follow macroeconomic factors. Momentum investment strategy should be devised differently across the different market states. The presence of momentum profit examination may be carried out in other asset market context including commodity, currency, mutual funds etc. Examination of momentum persistence and momentum crashes across different phases of business cycles may be a good idea for the scholars who are interested in studying emerging markets.
Copyright © 2026 Research and Reviews, All Rights Reserved