ISSN: 1204-5357
ISSN: 1204-5357
Folasade Bosede Adegboye*
Department of Banking and Finance, Covenant University, Nigeria
Joshua Adewale T Ojo
Department of Banking and Finance, Covenant University, Nigeria
Felicia Omowunmi Olokoyo
Department of Banking and Finance, Covenant University, Nigeria
Visit for more related articles at Journal of Internet Banking and Commerce
Africa unlike other developing regions of the world has experienced declining flows of foreign direct investment (FDI).The flow of FDI is expected to result into gradual reduction in reliance on external borrowed capital and acceleration of economic development. The study examined the declining flow of FDI to the African regions as well as the impact that it has had on economic development of the region, using the proxies of Income per capita, Life expectancy and Education indices. The study made use of pooled data from thirty nine African countries within the period 1993 and 2012.The method of analysis utilized for the study was the fixed effect least-square dummy variable model, employed to estimate the impact of foreign direct investment on economic development for the selected host African countries. The study finds that foreign direct investment is statistically significant in relation to economic development for host African countries. It is therefore recommended that the governments of host countries should consider closely the sectors that FDI flows into, encourage investment domestically in such sectors such that dependence on external financial flows could be reduced, resulting in sustained increases in income, literacy level and hence improved life expectancy which are expected to result into sustained economic development.
Foreign Direct Investment; Economic Development; Host African Countries; Education, Income Per Capita, Life Expectancy
An inflow of foreign direct investment is expected to contribute to the recipient country’s development program in two general ways - by helping to reduce the shortage of domestic savings and by increasing the supply of foreign exchange. To this extent, the recipient of private foreign investment permits a more rapid expansion of real income, eases the shortage of foreign exchange, and removes the necessity of resorting to drive toward self-sufficiency and the deliberate stimulation of import-substitution industries out of deference to foreign exchange.
This study focused on the impact of foreign direct investment on the economic development of host African countries. Over the past four decades, foreign direct investment (FDI) in the regions of Africa has been erratic and volatile in nature. The volume of FDI has increased sluggishly over the past four decades in the African regions. The pattern of flow however, has been that of sharp increases followed by sharp decreases in subsequent years. Also, the flow of FDI to African regions has declined in comparison to other developing regions in the world over the years. For instance, in 1980; of the FDI flows to developing regions of the world, only 5% was received by Africa, 86% - Latin America, and 7% Asia. By 1990, Africa had 8% proportion of flow, Latin America 26% while Asia had 65%. Even in 2010, Africa received 10% of FDI to developing regions, Latin America 28% and Asia 62%. This characterized the flow of capital to Africa as the increase in capital flow was not in the same proportion as to other developing regions of the world [1].
The rate of return on FDI in the world has been interesting such that, the developing countries show greatest potential of return on investments in their countries and therefore should attract more foreign capital. Economic theory also harnesses the fact that capital should flow from rich countries to poor countries. Poor countries with lower levels of capital per worker, the scarcity of capital relative to labour should mean that the returns to capital are high. In response, savers in rich countries should look at poor countries as profitable places in which to invest. In reality, things just do not seem to work that way. In reality, little capital flows from rich countries to poor countries. This puzzle, famously discussed in a paper by Nobel Laureate Robert Lucas in 1990, is often referred to as the “Lucas Paradox.” Lucas himself put forward several candidate explanations, including differences in human capital between rich and poor countries as well as the failures in international capital markets that might account for the lack of flows. But none of these candidates can come near to explaining quantitatively, the observed shortage of capital flows relative to what economic theory, specifically the neoclassical growth model, would predict.
Also in the research work of Prasad et al. [2] it was also argued that; flows of capital from rich to poor countries are important because they can serve to augment the stock of capital and boost incomes in poorer countries. They stated that when these inflows take the form of (FDI), the effect on incomes can be substantial; due to the fact that FDI often brings with it managerial and technological know-how. As a result, large flows of capital from rich to poor countries could potentially contribute to convergence in per capita incomes. These flows do not happen on a large scale; however, we do not see widespread convergence of living standards between rich and poor countries.
The expected flow of FDI should be enormous to developing countries, due to the predicted inverse relationship that exists between FDI flow and rate of return on investment. Since the developing African countries most vividly have high rate of return on investment, the flow of FDI, therefore, should be commensurately huge. This, however, as enumerated above has not been the case concerning the flow of FDI into host African countries.
Empirical studies on the questions of foreign private investment, LDC’s lingering issues centre mainly on the following:
a. That the advanced investing countries take-out more than they invest in less developed countries;
b. That as a result of (a), involving heavy remittances from host of investing countries as profit and interests, the balance of payment effects are adverse to the host countries and favourable to the investing countries;
c. That this type of investment leads to foreign ‘exploitation and domination’, that is, that loan financing leads to less foreign control than equity investment;
d. That the investors have been mainly profit minded without any regard to the development of the LDC’s; and
e. That foreign direct investment is a particularly expensive form of capital to LDC’s.
It is mainly in the examination of the above issues in each particular case rather than on a general basis (as attempted here) that the exact position could be brought out. While various arguments are usually put in support of these issues, there are arguments against them as well. It is argued that direct foreign investment exerts an impact on almost every aspect of life in the recipient country. Measurement in some cases is extremely difficult if not impossible. The total private direct investment by industrial countries in LDC’s, is offset by large generally unrecorded flow of private capital from developing countries to the developed countries. It has been claimed some decades past that these revenue flows may exceed those that move from developed to developing countries, according to John Pincus.
Countries that have accessed flow of foreign capital have been said to have done better than countries that have not, in terms of improvement in per capita income and standard of living [3]. The research of Chenery et al. [4] principally aimed at outlining a theoretical framework designed to analyse the process of development with external assistance in quantitative terms and to evaluate the current performance of the developing countries and assess their future needs for assistance under various assumptions. Results showed that a substantial increase in investment financed largely by foreign loans and grants has led to rapid growth of GNP followed by a steady decline in the dependence on external financing.
From the standpoint of contributing to the development process, the major benefits from foreign investment are seen as likely to arise in the form of external economies. Besides bringing to the recipient country physical and financial capital, direct foreign investment also includes nonmonetary transfers of other resources – technological knowledge, market information, managerial and supervisory personnel, organizational experience, and innovation in products and production techniques – all of which are in short supply. Private foreign investment as viewed by Meier [5], can also stimulate additional domestic investment in the recipient country. If the foreign capital is used to develop the country’s infrastructure, it may directly facilitate more investment.
Foreign direct investment can promote the economic development of host countries, with discipline on macroeconomic policies. The entry of foreign capital increases competition, boosts efficiency, enhances technological advancement, enhances domestic investment and reduces overhead cost. This aids in stimulating economic activities, not only by reason of the foreign investment but also by invigorating domestic investment which further engenders increase in economic activities, thereby ensuring maximal utilization of resources, with the resultant effect of national growth and development. The stimulating environment for development has therefore been inaccessible despite the anticipated prospects, due probably to likely paucity of economic activities, coupled with macroeconomic instability and other social challenges which are peculiar to developing economies.
In the context of development program, foreign capital as further shown by Meier [5] has a dual role in enabling the recipient country to raise its level of investment and increase its imports. Although within a general development program it is not possible to identify any one source of funds with a specific type of use, a net capital inflow can offset or “finance” all three of the following differences as aggregates:
i. Value of products used minus value of products produced domestically;
ii. Net investment minus net domestic savings;
iii. Value of imported goods and services, including factor payments minus value of exported goods and services, including factor receipts.
The foreign capital requirements of a development plan can therefore be expressed either as the need to fill the “savings gap” or cover the “foreign exchange gap”.
Foreign direct investment has been expected to have a positive impact on economic development in African countries. Diverging empirical results have prompted several researchers to look for explanations for these seeming deviations in observed findings. Some initial research results support this perspective. For example, in the initial work of Borensztein et al. [6], the main regression result indicates that FDI has a positive overall effect on economic growth, although the magnitude of this effect depends on the stock of human capital available in the host economy. However, the nature of the interaction of FDI with human capital is such that for countries with very low levels of human capital the direct effect of FDI is negative.
The cross-country regressions also show that FDI exerts a positive, though not strong, effect on domestic investment, presumably because the attraction of complementary activities dominates the displacement of domestic competitors. This is an indirect effect of FDI on growth, since it operates through ‘pulling in’ other sources of investment. The study examined the empirical role of FDI in the process of technology diffusion and economic growth in developing countries. It was motivated by a model of endogenous growth, in which the rate of technological progress is the main determinant of the long-term growth rate of income.
Lumbila [7], sought to examine the impact of FDI on economic growth regarding existing fragile empirical evidence. Also, Lumbila [7] identified the factors that enhance FDI effect on growth in a manner that differs from what has been done in previous studies. This was done by extending the model of Borensztein et al. [6] to include infrastructure, risk and corruption in addition to education as factors that determine the impact of FDI on growth in Africa. The method used was cross country regression analysis on panel data to determine the impact of FDI on growth in Africa and the scope of the study covered 47 African countries for the period 1980-2000. He summed that macro environment in the host countries enhanced the impact of FDI on growth. The regression results reveal that corruption does not matter in the case of FDI. Thus, countries where corruption is perceived to be high still benefit from a positive impact of FDI on growth. Although, the Hausman test performed on the data used in the paper was also not able to find the systemic difference, and there was also the presence of both heteroskedasticity and autocorrelation in the data analysed.
The research of Ayanwale [8] examined the relationship between FDI inflow and Nigeria’s economic growth, hence addressing the country’s specific dimension to the FDI growth debate. The study considered a scope larger than previous studies in terms of number of years and the effect of major components of FDI on economic growth. It exploited the opportunity of access to differential impact of oil FDI and non-oil FDI on Nigeria’s economic growth. The study also investigated the empirical relationship between non-extractive FDI and economic growth, examining the determinants of FDI in the Nigerian economy. The period of analysis was 1970-2002, and the augmented growth model was estimated via the ordinary least square and the 2SLS method of analysis. The researcher found that; openness is negatively related to FDI inflow. Infrastructure and returns on investment both have a positive relation with FDI, though returns on investment are not statistically significant. There is a positive relationship between FDI inflow; inflation, and government size. Whereas there is a negative relationship between FDI inflow; human capital and political stability. FDI in Nigeria contributes positively to economic growth. Although the overall effect of FDI on economic growth may not be significant, the components of FDI do have a positive impact.
The research of Baltabaev [9] was premised on the technological spill overs theory, aimed at improving the understanding of FDI growth relationship as well as testing the advantage of relative backwardness hypothesis in a consistent econometric framework. It was found in the study that: the positive effect of FDI on total factor productivity growth depended on the level of the absorptive capacity of receiving countries in terms of the distance to the technology leader (technology gap). The results suggest that the countries with larger technology gaps seemed to have benefited more from FDI. The GMM estimation method was used in the analysis of the panel data set. However, there is evidence of presence of heteroskedasticity of the variables set. The result was also not fully reported probably the instance of making the work compact. This limited access to empirical proofs of the research assertions.
The data employed in this paper were sourced from UNCTAD [1,10], World Bank [11,12], and the study of Adegboye [13]. A test of the effect of FDI net inflow on economic development is performed in a framework of cross-country regressions, utilizing data on FDI net inflows to thirty-nine African countries for the period 1993-2012. Based on the theory of foreign direct investment, countries that access flow of foreign capital are expected to do better than countries that do not in terms of improvement in per capita income and standard of living [3].
The dependent variables are GDPk, LIEXPT, and EDUI; the annual percentage growth of GDP per capita, life expectancy at birth and education proxy of economic development. They are usually used as indicators of development in the economy. It is expected that higher GDPk, LIEXPT, and EDUI are associated with higher level of development in the economy. The independent variables are: Net inflow of foreign direct investment (FDI), Active labour force (L), gross fixed capital formation (K), trade openness (TO), technology (T), the rate of return on investment of capital (ROI), money and quasi money (M2), level of corruption (CRPT), percentage change in the GDP deflator or consumer price index (INFLT), government final consumption expenditure (GOVTCONS), infrastructure (INFRST), and nominal exchange rates (EXR).
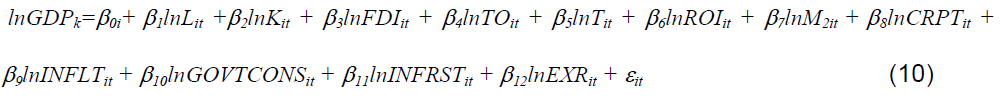
This study tested the direct effect of net inflow of FDI on economic development. The model below is drawn from the study of Lumbila [7] and modified by eliminating some variables, namely: institutional quality, the rule of law indicator proxy, and the initial level of GDP per capita, because they are not quite relevant to the present study focus. The model included more macroeconomic variables: inflation, exchange rate, money supply and other variables like government final consumption expenditure, infrastructure, and corruption.
The models are stated below:
 (1)
(1)
 (2)
(2)
 (3)
(3)
The models are stated in Cobb-Douglas form as below:
 (4)
(4)
 (5)
(5)
 (6)
(6)
The standard Cobb-Douglas Production Function:
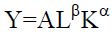
Where: Y=total production (the real value of all goods produced in a year), L=labor input (the total number of person-hours worked in a year), K=capital input (the real value of all machinery, equipment, and buildings), A=total factor productivity α and β are the output elasticity’s of capital and labor, respectively. These values are constants determined by available technology.
Where GDPk: the annual percentage growth of GDP per capita
LIEXPT: the life expectancy
EDUI: education proxy
A: Total factor productivity
L: Active labour force
K: Gross fixed capital formation
FDI: Net inflow of foreign direct investment
TO: Trade openness
T: Technology
ROI: Rate of return on investment
M2: Money and quasi money
CRPT: level of corruption
INFLT: Percentage change in the GDP deflator or consumer price index
GOVTCONS: government final consumption expenditure
INFRST: infrastructure
EXR: nominal exchange rates
β0, β1, β2, β3, β4 β5 β6 β7 β8 β9 β10 β11and β12: are the coefficients.
The Cobb-Douglas form of the models cannot be estimated directly using the OLS technique since it is non-linear; so it is necessary to transform them into linear form that allows the equation to be estimated. The essence of this is that it provides estimated parameters that can be interpreted directly as elasticity.
To estimate the following equation:


Stating equations (3.7), (3.8) and (3.9) in panel form therefore, we have;


All data were taken from United Nations Statistical Department, World Bank, World Development Indicators, World Governance Indicators, and African Development Indicators. These are for the specified period from, 1993 till 2012, and for the 39 selected African countries.
To test the hypotheses, data on GDP per capita, life expectancy, education proxy, active labour force, gross fixed capital formation, foreign direct investment, trade openness, technology, rate of return on investment, money supply, level of corruption, inflation, government expenditure, infrastructure, and nominal exchange rate were utilized in host economies. Data on all variables by country of origin are available from 1993 to 2012, for all the selected 39 African host economies in the sample to test for the direct effect of FDI net inflow on economic development.
Graphical Representations
Graph A1.1 in Appendix I represents the trend and pattern of FDI net inflow over the period a radical increase in FDI net inflow can be seen in the African region within 2005 and 2008. A fall was experienced between 2008 and 2010; this period was noted as the period of the sub-prime mortgage crisis. The net inflow of FDI again picked up about 2011, with continued increase in flow.
The graph A1.2 in Appendix I represent the trend of GDP per capita for African countries that have benefited from FDI net inflow over the specified period. It can be seen from the trend graph that GDPk has consistently increased except for a very short period, specifically between 2008 and 2010, which is noted as the period of sub-prime mortgage crisis. This is the same period when there was a decline in FDI net inflow. FDI net inflow is expected to close income gaps by increasing GDP per capita and hence increase saving and consequently investment to close the income gap.
The trend pattern of Life Expectancy as a measure of economic development can be seen in graph A1.3 in Appendix I. There was a slight decline between 1995 and 2000. The pattern of the graph changed to a continuous increase, however, from year 2000. This shows a pattern of economic development as it relates to better life expectancy of the African region.
The trend line of education proxy, which is represented by primary school enrolment, depicts that there has been continuous increase in school enrolment over the years. This shows that the level of education has been on the increase though at a very low magnitude. From the trend graph of the education proxy graph A1.4 in Appendix I, it can be deduced that the level of education has been increasing constantly over the years, irrespective of the years when net inflow of FDI declined. This, therefore, reveals that the level of education is determined by other factors particularly government education policies in several levels of government as well as improvement in primary activities.
Unit Roots Test
From the analysis of the result in Table 1 below, the unit root test presentation, all variables are significant at 1 percent level of significance. This indicates that they are all stationary at 1 percent (Table A2.1 in Appendix 2). To this end, therefore, we hereby reject the null hypothesis that all panels contain unit roots. We, hereby, accept the alternative hypothesis that at least one panel is stationary. Since all are stationary, we, hereby, proceed to the pooled regression analysis as results are reliable and not spurious.
Table 1: Unit Roots Test- Augmented Dickey-Fuller Tests. Source: Adegboye [13].
| Variables | Chi-Squared Statistics | Remark |
|---|---|---|
| GDPK | 124.66 (0.0006) | Stationary |
| EDUI | 195.75 (0.0000) | Stationary |
| LIEXPT | 279.55 (0.0000) | Stationary |
| FDI | 81.83 (0.0086) | Stationary |
| L | 401.19 (0.0000) | Stationary |
| K | 263.14 (0.0000) | Stationary |
| TO | 171.93 (0.0000) | Stationary |
| T | 1282.31 (0.0000) | Stationary |
| ROI | 110.57 (0.0090) | Stationary |
| M2 | 186.41 (0.0000) | Stationary |
| CRPT | 412.90 (0.0000) | Stationary |
| Inflt | 276.06 (0.0000) | Stationary |
| Govtcons | 160.50 (0.0000) | Stationary |
| INFRST | 175.21 (0.0000) | Stationary |
| EXR | 543.68 (0.0000) | Stationary |
| Number of Panels 39 Number of Periods 20 |
||
Fixed Effect Least Square Dummy Variable Analysis
Equations (10), (11) and (12) in section three were estimated to obtain the results in Table 2. Regressions I, II and III columns show the results of the equations, where GDPk, LIEXPT and EDUI are dependent variables in the respective regression columns, estimating economic development in partial context. The results in Table 2 showed that R2 and Adjusted R2 for GDPK are 0.9780 and 0.9762 respectively. The result shows that the independent variables explain the respective variations of the income proxy used to measure economic development. For the t-statistics, the result shows that the variables are significant as most of the values are above 2, thereby, showing level of significance. The F-statistics has a value of 552.24(0.0000), which shows that it is significant at 1 percent level in explaining the income proxy of economic development. It can be noted from the results, therefore, that for regression I, where GDPk is income per capita (proxy of economic development), FDI net inflow is significant at 5 percent. The coefficient of FDI net inflow is inelastic, that is, the coefficient employed in measuring the elasticity is less than one in absolute values. This means that a one percent change in FDI net inflow brings about a less than one percent change in economic development. This explains why even though FDI net inflow is expected to have significant impact on economic development, the impact is minimal for the selected African countries.
Regression II, where LIEXPT (life expectancy at birth) is proxy of economic development, the following observations are identified from the estimated results. The R2 and Adjusted R2 for LIEXPT are 0.9484 and 0.9443 respectively; these reveal that independent variables explain the respective variations in life expectancy proxy of economic development. The t-statistics are significant and the F-statistics has a value of 228.30(0.0000), which shows that it is significant at 1 percent level in explaining the life expectancy proxy of economic development. FDI net inflow is significant at 5 percent. The coefficients of FDI net inflow is inelastic, that is, the coefficients employed in measuring the elasticity’s are less than one in absolute values. This implies that a one percent change in FDI net inflow will bring about a less than one percent change in economic development. Invariably, though FDI net inflow is expected to have a significant impact on economic development, the impact is minimal on host African countries’ economic development.
Table 2: Estimated Regression Result. Source: Adegboye [13].
| Dependent Variable - Measure Of Economic Development (GDPK; LIEXPT; EDUI) | ||||||
|---|---|---|---|---|---|---|
| Variable | Regression I GDPK LSDV Pooled OLS | Regression II LIEXPT LSDV Pooled OLS | Regression III EDUI LSDV Pooled OLS | |||
| LNFDI | 0.013** [ 2.30] 0.060*** [6.24] (0.022) (0.000) | 0.003**[2.30] 0.006** [2.47] (0.022) (0.014) | 0.009** [ 1.99] -0.009 [1.56] (0.047) (0.119) | |||
| LNL | -0.156 [1.36 ] -0.715*** [27.58] (0.173) (0.000) | 0.078***[3.16 ] -0.027*** [4.31] (0.002) (0.000) | 0.538*** [6.04] 0.044*** [2.92] (0.000) (0.004) | |||
| LNK | 1.068*** [23.63] 0.268*** [8.32] (0.000) (0.000) | -0.010 [1.05] 0.025*** [3.22] (0.295) (0.001) | -0.146***[4.15] 0.116*** [ 6.20] (0.000) (0.000) | |||
| LNTO | -0.235*** [7.02] 0.079** [2.03] (0.000) (0.043) | 0.007 [0.93] -0.079*** [8.40] (0.352) (0.000) | 0.090*** [3.46] 0.207*** [9.12] (0.001) (0.000) | |||
| LNT | -0.015*** [3.80] 0.013** [2.23] (0.000) (0.026) | -0.003***[3.94] -0.005*** [3.59] (0.000) (0.000) | 0.0150***[4.74] 0.024*** [7.20] (0.000) (0.000) | |||
| LNROI | -1.063*** [21.63] -0.216*** [5.38] (0.000) (0.000) | 0.025** [2.39] 0.037*** [3.78] (0.017) (0.000) | 0.181*** [4.73] -0.075*** [-3.21] (0.000) (0.001) | |||
| NM2 | 0.238*** [13.99] 0.499*** [21.09] (0.000) (0.000) | 0.015***[4.12] 0.038*** [6.70] (0.000) (0.000) | -0.029** [2.17] -0.058*** [4.24] (0.030) (0.000) | |||
| LNCRPT | -0.003 [0.10] -0.079* [1.83] (0.920) (0.068) | 0.008 [1.49] 0.008 [0.83] (0.135) (0.405) | 0.060***[2.96] -0.018 [0.73] (0.003) (0.468) | |||
| LNINFLT | 0.001 [0.43] -0.007 [0.97] (0.671) (0.333) | 0.0004 [0.56] -0.001 [0.50] (0.574) (0.616) | -0.007***[2.70] 0.003 [0.78] (0.007) ( 0.434) | |||
| LNGOVTCONS | 0.079*** [3.40] -0.144*** [4.53] (0.001) (0.000) | 0.015***[3.05] -0.040*** [5.17] (0.002) (0.000) | 0.053***[2.94] -0.070*** [3.80] (0.003) (0.000) | |||
| LNINFRST | -0.058*** [2.79] 0.029 [1.23] (0.005) (0.218) | 0.003 [0.73 ] 0.049*** [8.70] (0.466) (0.000) | -0.019 [1.18] 0.086*** [6.32] (0.238) (0.000) | |||
| LNEXR | -0.259*** [15.48] -0.591*** [26.23] (0.000) (0.000) | -0.010*** [2.72] -0.025*** [ 4.69] (0.007) (0.000) | -0.015 [1.12] 0.022* [1.67] (0.262) (0.095) | |||
| CONSTANT | -24.846***[14.05] 3.232*** [10.93] (0.000) (0.000) | 1.90*** [4.95] 3.980*** [55.75] (0.000) (0.000) | -2.37* [1.72] 3.664*** [21.32] (0.085) (0.000) | |||
| R2 | 0.9780 | 0.8604 | 0.9484 | 0.5956 | 0.8213 | 0.3670 |
| Adjusted R2 | 0.9762 | 0.8579 | 0.9443 | 0.5883 | 0.8069 | 0.3555 |
| F-Stat | 552.24 (0.0000) | 338.61 (0.0000) | 228.30 (0.0000) | 80.89 (0.0000) | 57.09 (0.0000) | 31.84 (0.0000) |
| No of Countries Dummy | 39 | 39 | 39 | 39 | 39 | 39 |
| Countries Number of Observations | Yes No | Yes No | Yes No | |||
| 672 672 | 672 672 | 672 672 | ||||
| *indicates significance at 10 percent; **significance at 5%; ***significance at 1%. | ||||||
For regression III, where EDUI (level of education) is proxy of economic development, the following observations are highlighted from the estimated result. The R2 and Adjusted R2 for EDUI are 0.8213 and 0.8069 respectively. The results show that the independent variables explain the respective variations of the level of education (proxy of economic development). For the t-statistics, the results show that the variables are significant, as most of the values as contained in the Table 2 are above 2, thereby showing level of significance. The F-statistics has a value of 57.09(0.0000) which shows that it is significant at 1 percent level in explaining the level of education proxy of economic development. FDI net inflow is significant at 5 percent level. The results show that the coefficient of FDI net inflow is inelastic, that is, the coefficient employed in measuring the elasticity is less than one in absolute value. This implies that a one percent change in FDI net inflow will bring about a less than one percent change in economic development. This shows that, though FDI is significant in explaining economic development in the selected African countries, the seeming improvement in the level of education of the inhabitants of the host nations is minimal, which is probably as a result of some other factors required for educational improvement.
Regression I are the results of income level (GDPK), as a proxy for economic development, while regression II and III are results of level of life expectancy (LIEXPT) as a proxy for economic development and education (EDUI) as proxy for Economic Development respectively. Absolute t statistics are displayed in parenthesis beside the coefficient estimates, while probability values are in brackets under the coefficient estimates.
This study has investigated foreign direct investment and economic development with evidences from selected African countries. The impact of the net inflow of foreign direct investment has been ascertained in relation to the several proxies of economic development. The estimated results of the models reveal that: Foreign Direct Investment is significant at 5 percent for all proxies of economic development as highlighted in equations (10), (11) and (12); this is emphasized in Table 2.
The research of Chenery et al. [4] validates the positive significant relationship of FDI net inflow and economic growth. They further affirm that as income increases as a result of flow of foreign capital, there is also a steady decline in dependence on external financing. Growth and ability to sustain further development by nations’ resources also increase. This positive relationship is also corroborated by the research of Ojo et al. [14]; Lumbila [7]; Fortanier [15]; Asiedu [16]; Ahmed et al. [17]; Sarode [18], Prasad et al. [2]; Borensztein et al. [6]; Kose et al. [19]; Adegboye [13] and Baltabaev [9]. This study has found that a positive and significant relationship exists between foreign direct investment and economic development. The majority of previous studies focused on economic growth, but this study takes a step further to find the impact of foreign direct investment, not only on growth by estimating increase in income per capita, but other forms of measure of development, life expectancy and level of education proxy. We found foreign direct investment to be significant positively in relation to all proxies of economic development, however, at a minimal magnitude.
The flow of foreign direct investment into the economy should, cet. par. increase domestic investment and economic activities to have net beneficial impact on the host economies [20]. Governments of countries that welcome the flow of foreign direct investment should do so with appropriate policies to channel the flows to sectors of critical importance. This is to ensure that the direction of flows falls within the overall development plan of the country. It is expedient also that as the domestic sector is developed with evidence of increases in income among others; it should be sustained to ensure lasting developmental impact.
From the results of this and other studies, however, it is clear that while governments are usually enticed by the attractiveness of foreign direct investment for the positive spillovers that it can generate, governments should be cautioned that the desired spillover effects are not automatic, and that the presence of FDI alone is insufficient to reap the desired benefits for the specific local economy.
We can conclude, from the results of this study that a positive significant relationship exists between net inflow of foreign direct investment and economic development, though at a minimal magnitude. As net inflow of foreign direct investment increases, the resultant increase in income invariably does not significantly impact the domestic sector, with the expected increase in investment. Nonetheless, the flow of foreign direct investment should bring about economic development by accelerating domestic investment, level of production, income, etc., resulting into a steady decline in dependence on external financing. Growth in income, life expectancy and education put together results into better standard of living and ability to sustain further development. The sustainability of investment domestically, alongside with sustainable socio-economic environment, will bring the desired economic development to host African countries.
Copyright © 2026 Research and Reviews, All Rights Reserved