Keywords
|
| Efficiency, Online banks, Data Envelopment Analysis |
INTRODUCTION
|
| In recent years the performance measurement concerns for financial institutions have attracted a great deal of attention. Given that the structures of financial service industries are changing rapidly, it is of considerable interest to measure the efficiency of evolving institutions, and explain measured variation in the (in) efficiency of institutions. Due to deregulation in the banking industry, there is a trend for banks to merge with others and become larger. These trends leave survival questions that must be answered. Is it necessary to know that banks should be big to achieve scale economies? If economies of scale do exist, is there any survival value of small banks? Do banks with a variety of financial service products operate more efficiency than the banks with specialties? This study attempts to answer these questions by examining the efficiency of the banking industry as a whole. |
| In order to compete with non-bank, financial institutions, banks should be increasing their levels of efficiency. In this competitive environment, banks are forced to examine their performance because their survival will be dependent upon their productive efficiencies. Efficiency measures are important because it is a factor for productivity growth. The measurement of efficiency has remained an area of important research both in the developing and developed countries. This is especially important in developing countries, where resources are inefficient and opportunities for developing and adopting better technologies are diminishing. Such studies benefit these economies by determining the extent to which it is possible to raise productivity by improving the neglected source of growth i.e. efficiency, with the existing resource base and available technology. |
| Two different approaches are available to measuring efficiency: the non-parametric (or linear programming) and parametric (or stochastic frontier production function) approaches. |
| As to the parametric technique, a crucial disadvantage is the pre-specified functional form for efficiency frontier, which may result in an inaccurate efficiency measurement (Berger and Humphrey, 1997). |
| Another way to estimate efficiency measures is the non-parametric frontier method–Data Envelopment Analysis (DEA) which has become increasingly popular in efficiency analysis. DEA allows efficiency to vary over time and does not require prior assumption of the distribution of inefficiency across observations. It is a popular technique to evaluate bank efficiency performance and productivity improvement which combining all input and output data of the bank in a single measures. The way data envelopment analysis (DEA) approach was pioneered by Charnes, Cooper, and Rhodes (or CCR) (1978) and later extended by Banker, Charnes, and Cooper (or BCC) (1984). This approach decomposes of technical efficiency into pure technical efficiency and scale efficiency. Sherman and Gold (1985) were the first to apply DEA to banking. One of the most important features of DEA is its ability to manage the multiple characteristics of a bank, which use several inputs and outputs. |
| The authors believe that in Bangladeshi banking sector DEA technique were not used remarkably. We employed DEA in order to investigate the productivity improvement of banks along with the determinants of their efficiency. This study seeks to measure the individual efficiency of Bangladeshi banks and to evaluate whether banks operate efficiently. The objective of DEA is to measure relative efficiency among similar units that share the same technology (or processing procedure) for similar goals (or outputs) through using similar resources (or inputs). |
Banking Study
|
| The efficiency of banking sector is one of the most interesting economic issues for economists all over the world. Chansarn (2007) investigated the efficiency of Thailand’s financial sector including banking sector after the financial crisis in 1997 by looking at the total factor productivity (TFP) growth. In addition, Rangkakulnuwat (2007) utilized Data Envelopment Analysis (DEA) to estimate the technical efficiency of nine Thai commercial banks from 2000 to 2005. Although, there are many ways adopted to examine the efficiency of commercial banks, Data Envelopment Analysis (DEA) seems to be more popular among economists. DEA was originally introduced by Charnes, Cooper and Rhodes (1978) as they proposed a nonlinear programming model to measure the relative efficiency of decision making units (DMUs). |
| Since the mid-1980s, DEA has been receiving importance as a technique for measuring efficiency of commercial banks in several countries. For instance, Casu and Molyneux (2000) employed the DEA approach to investigate the efficiency in European banking systems. Halkos and Salamouris (2001) utilized the DEA approach to measure the efficiency of the Greek banking sector with the use of a number of suggested financial ratios for the time period 1997 – 1999. Jemric and Vujcic (2002) used DEA to analyze bank efficiency in Croatia. Wu (2002) conducted productivity and efficiency analysis of banks operation in Australia since the deregulation of the Australian financial system in early 1980s. Ozkan-Gunnay and Tektas (2006) assessed the technical efficiency of nonpublic commercial banks in Turkey between 1990 and 2001, following the DEA model. Debasish (2006) attempted to measure the relative performance of Indian banks, using the output-oriented CRR DEA model. Finally, Luciano (2007) illustrated the efficiency features of Italian banking system with DEA through the review of the most important empirical studies over the last fifteen years. |
Why study Bangladesh Banking Sector
|
| The banking sector of Bangladesh is relatively large to the size of its economy compare to other developing countries. The total size of this sector is at 26.54 percent of GDP while the total size of the non-bank financial sector is only 3.22 percent of GDP. The banking sector of Bangladesh comprises of four categories of scheduled banks (Schedule Bank Statistics, 2008). Banks are grouped into four categories (a) State- Owned banks, (b) Islamic banks, (c) Foreign banks and (d) Private banks. However, severe data limitations compel us to confine our attention to only 20 Bangladeshi banks in the database from the Economic Census for Enterprises for which we obtain sufficient balance sheets and income statements data on those banks in the country conducted by the Bangladesh Bank in 2001–2007. Among these there are 2 state-owned banks, 15 private banks and 3 Islamic banks. |
| The branches of banks in Bangladesh are increasing day by day as compare to other countries in the sub-continent. Hence, the banking system in Bangladesh is a significant problem. Therefore, Bangladesh banking industry is a motivating subject for this study for two reasons. First no earlier study has been intended to estimate technical efficiency and productivity improvement using DEA. Second Bangladesh banking sector is one of the most flourishing industries in this sub-continent and foreign investors are increasingly attracted to grasp this sector. Thus it is very important to look into Bangladesh banking sector. |
MATERIALS AND METHODS
|
The CCR Model
|
| The CCR model allows each bank to adopt its own set of weights, thus maximizes its own best possible efficiency in comparison to the other banks. Under these circumstances, the efficiency for a bank is determined as a maximum of a ratio of outputs to weighted inputs. |
| The algebraic model for the CCR (input based) ratio form is as follows: |
 |
| where |
| c = a specific bank to be evaluated, yrj = the amount of output r from bank j, x ij= the |
| amount of input i to bank j, ur = weight chosen for output r, vi = weight chosen for input |
| i, n = number of banks, s = the number of outputs, m = the number of inputs. |
| The problem setting in (1) can be converted into linear program (LP) form by restricting the denominator of the objective function hc to unity, and adding this as a constraint to the problem. |
| The LP version of the fractional setting is as follows: |
| Primal |
 |
 |
| The maximizing LP setting in (2) assumes constant returns to scale technologies. One possible solution to the LP (the primal) in (2) is to formulate a dual companion. By denoting input weights of bank c by θc and the input and output weights of other banks |
| in the sample byλj the dual form of the maximizing problem is formalized as follows: |
| Dual |
 |
The bank C is regarded as efficient if the θc is equal to one and the slacks (S-iS+i ) are zero. That is, if only if, h*c =1 with S-*iS+*i = 0, for all c and j. The bank is regarded as inefficient if the inclusion of  as an extra constraint to the model (3) considers the variable returns to scale (VRS) in the production (Banker, Charnes and Cooper, 1984). as an extra constraint to the model (3) considers the variable returns to scale (VRS) in the production (Banker, Charnes and Cooper, 1984). |
Measurement of Variable
|
| Most of the DEA study follows an intermediation approach. Within the intermediation approach, the exact set of inputs and outputs used depend largely on data availability. The present study considered intermediation approach to specify outputs and inputs of commercial banks. Accordingly, deposits, capital and labor are defined as input variables and advance, investment and profit are defined as output variables. |
Data Set
|
| In this paper we used data for the period of 2001-2007 from 20 banks of Bangladesh. Banks are grouped into four categories (a) State-Owned banks, (b) Islamic banks, (c) Foreign banks (d) Private banks.According to Schedule Banks Statistics (January- March, 2008) there are 48 commercial banks in Bangladesh. Due to unavailability of data and several limitations we collected only data of 20 commercial banks. Among these 20 banks there are 2 state-owned banks, 15 private banks and 3 Islamic banks. For various purposes we could not collect any foreign bank and specialized bank. Most of the data were collected from the annual reports of the specific banks of Bangladesh and rest of them were collected from annual accounts of Scheduled Commercial Banks published by Bangladesh Bank, the central bank of Bangladesh. |
Output Variables
|
| Advance ( Y 1) : Advances are measured as total advances and it is used as first output and equal to total loans and advances. Banks create their profits primarily by issuing loans. |
| Investment ( Y 2) : Investments are measured as total advances (which includes investment in Government securities, other approved securities, share, bonds, and debentures and other investments). The investment is equal to total investment which includes treasury bills, prize bonds, zero coupon bonds, shares/ sponsor shares of financial institution and other companies. A bank tries to invest money to earn profits. |
| Profit ( Y3 ) : Banks and other financial institution tries to maximize their profitability for this reason profit is used an important output variable in commercial banks efficiency. In this study profit is equal to the pre-tax profit for all commercial banks. |
| Above nominal output values are deflated by respective consumer price index. |
Input Variables
|
| Deposit ( X1 ) : Deposit is the first input variable in this study. Deposit is measured by total deposits including checkable, non-transaction deposit such as savings accounts, time deposits etc. These variables are then deflated by relevant CPI. |
| Capital ( X2 ): Capital is measured as fixed assets including premises, furniture and other fixed assets. Capital figure are deflated by capital price index. |
| Labour ( X3 ): Number of employees is measured as the total number of employees. |
| Labor is one of the most important inputs to measures the productivity of a firm. Here labor means number of employee and is measured as the total number of employees which includes officers, sub-ordinates and clerk. All nominal values are converted to real by deflating with GDP deflator and all values are in their natural logarithms. |
RESULTS AND DISCUSSION
|
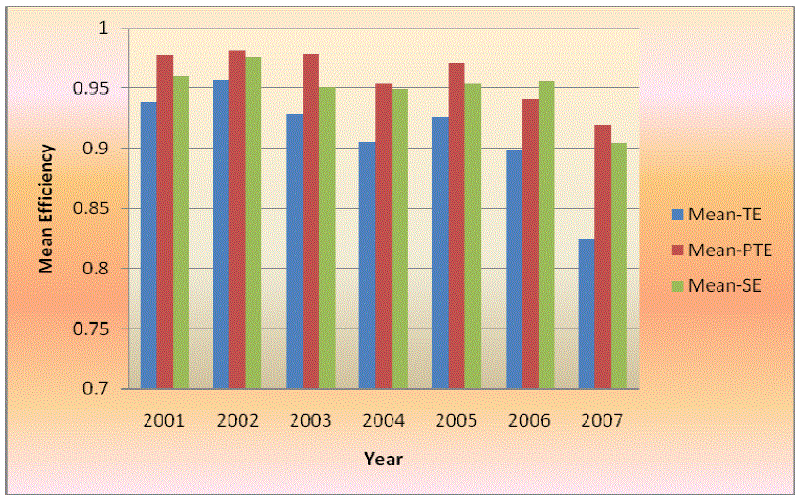
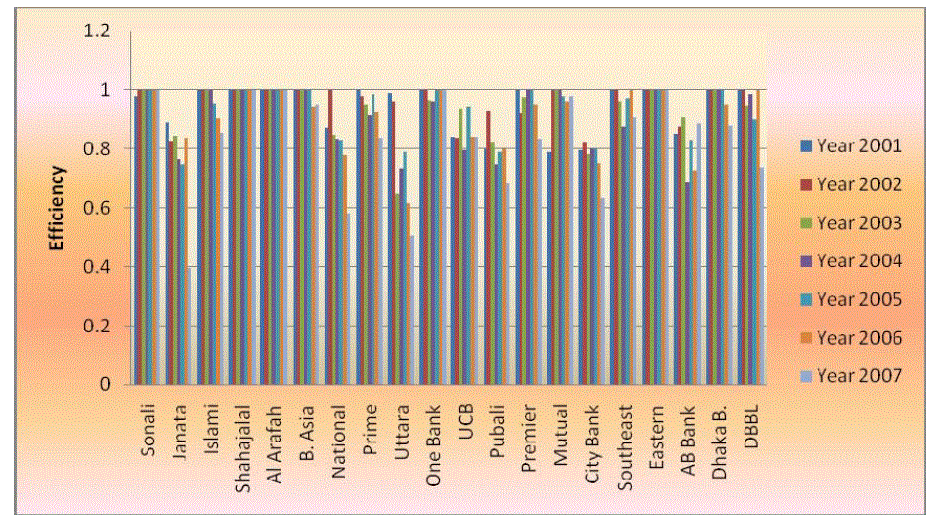
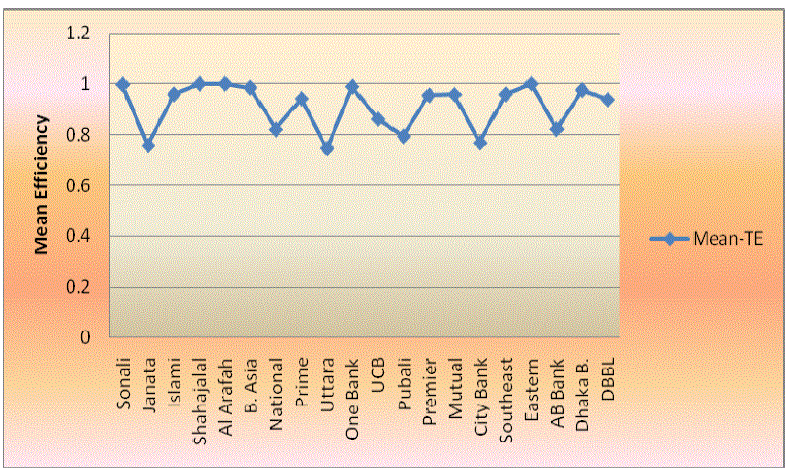
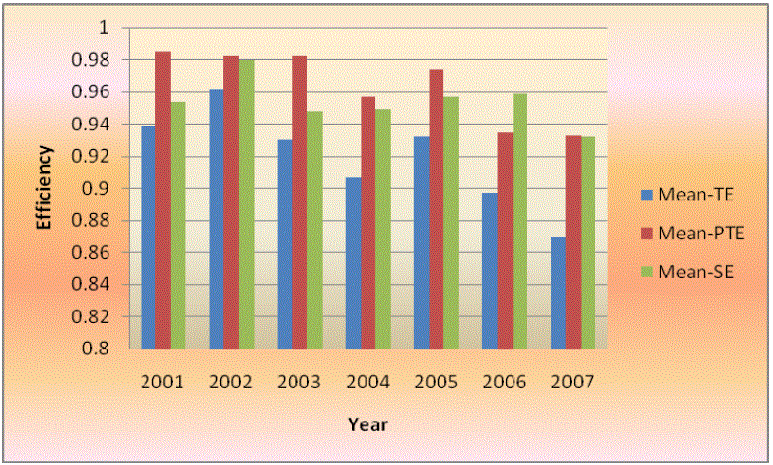
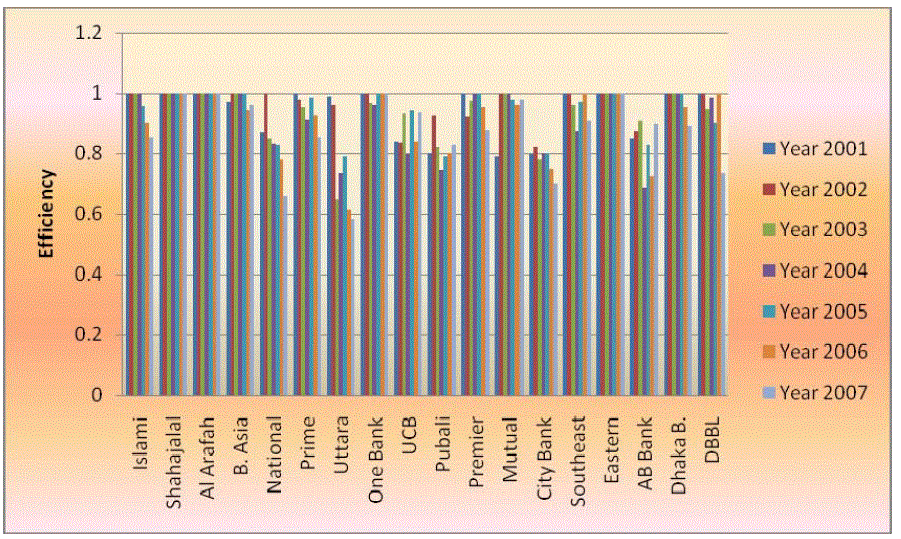
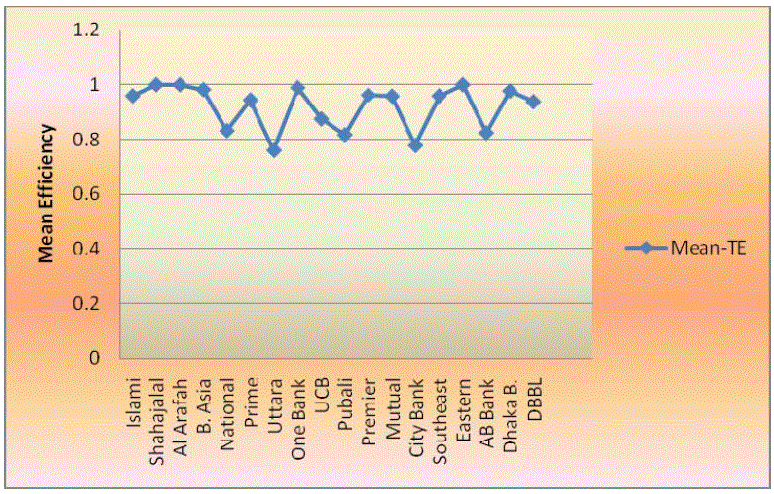
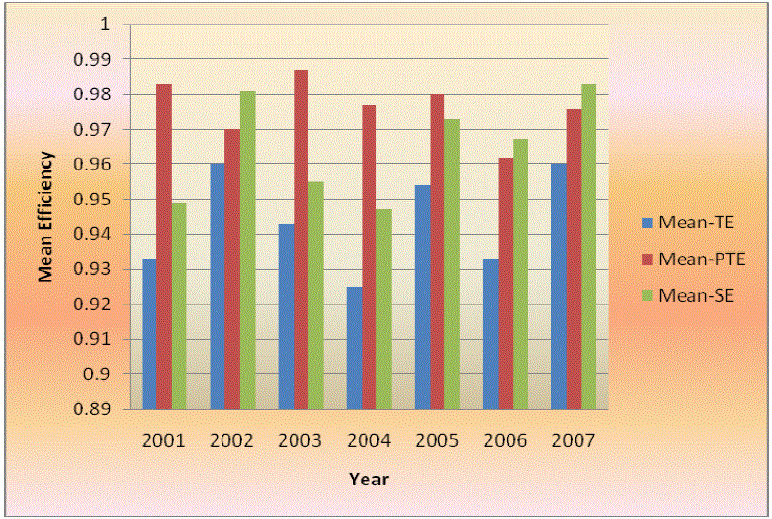
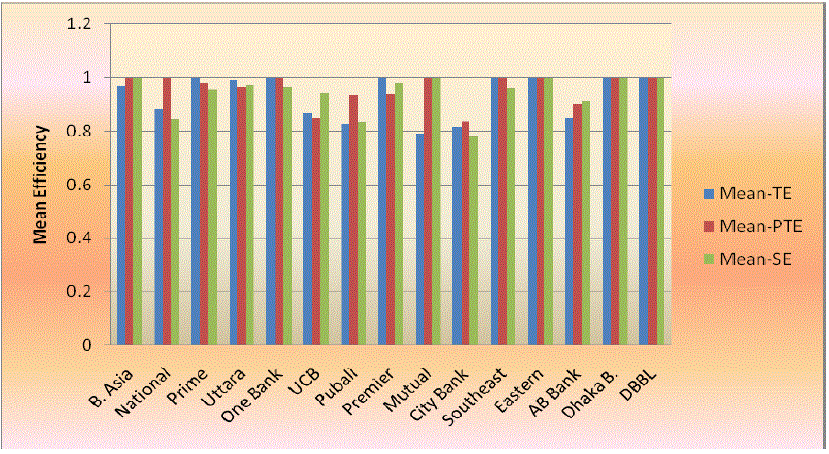
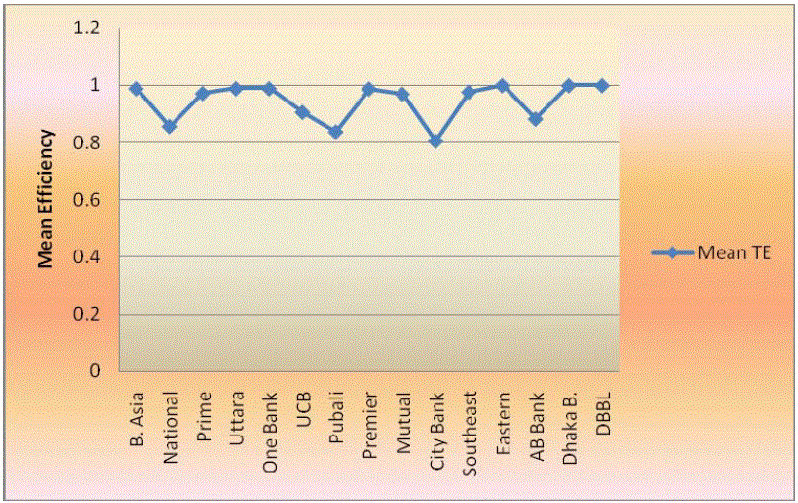
| In this section we dealt with the measurement of various technical efficiencies (e.g. technical efficiency, pure technical efficiency and scale efficiency) for Bangladeshi Commercial Banks using the non-parametric technique Data Envelopment Analysis (DEA). It was checked whether efficiency scores are stable and do not change dramatically when state-owned banks and Islamic banks are excluded from the sample. Even though state-own banks are only two but they dominated the sample period with respect to input and output variables shown in Table 1. The estimated efficiencies scores were displayed in Figures 1, 4 and 7 and a detailed presentation of the efficiency estimates for each bank were displayed by Figures 2, 3, 5, 6. 8 and 9. Difference among the efficiency scores for individual Banks was displayed in Table 2. |
| The estimated results indicated that the most technically efficient banks over the study period is Al-Arafah Islami Bank Limited, Shahajalal Islami Bank Bangladesh Limited and Eastern Bank Limited. The less efficient banks over the study period are Janata Bank Ltd, Uttara Bank Limited, United Commercial Bank Limited and Pubali Bank Limited AB Bank Ltd. From these we concluded that in Bangladesh Islamic Commercial Banks are more efficient than that of the State-Owned commercial Banks and the Private commercial banks (excluding Islamic banks). |
| Note: TE= Technical Efficiency, PTE= Pure Technical Efficiency, SE= Scale Efficiency The mean score of TE for these banks was found 93.9 percent in 2001, 95.7 percent in 2002, 92.9 percent in 2003, 90.5 percent in 2004, 92.6 percent in 2005, 89.9 percent in 2006, and 82.5 percent in 2007. |
| In general these efficiency scores were on a downward trend in the study period, although in first year there are slight increase in efficiency score but they gradually decreased in the next two years, again increased in the year 2005 but decreased comparatively large in the next two years 2006 and 2007. |
| The average mean score of SE for Bangladeshi banks (at 0.950) was observed which is lower than PTE (at 0.960) over the study period. Scale inefficiency was observed 0.053 while pure technical inefficiency was 0.042. These results suggested that technical inefficiency might be attributable to scale inefficiency rather than pure technical inefficiency. |
Analysis of Estimated Efficiency (excluding state –owned banks)
|
| Using the data of 18 commercial banks, the estimated result indicated that the most efficient banks over the study period are Shahajalal, Al-Arafah, and Eastern bank while less efficient banks are Uttara, UCB, Pubali, City, and AB bank. |
| The mean score of TE for these banks was 93.9% in 2001, 96.2% in 2002, 93.0% in 2003, 90.7% in 2004, 93.2% in 2005, 89.7% in 2006, 87.0% in 2007. In general it showed a downward trend. |
| The average mean score of SE for Bangladeshi banks (at .954) was lower than PTE (at .964) over the study period or in terms of inefficiency, scale inefficiency was .048 while pure technical inefficiency was .037.These results suggest that technical inefficiency might be attributable to scale inefficiency rather than pure technical inefficiency. |
Analysis of Estimated Efficiency (excluding State–owned and Islami Banks)
|
| Using the data of 15 commercial banks, the estimated result indicated that the most efficient banks over the study period were found Eastern bank, Dhaka bank and Dutch Bangla bank while less efficient banks were observed Pubali, City, and AB bank. The mean score of TE for these banks was found 93.3 percent in 2001, 96.0 percent in 2002, 94.3 percent in 2003, 92.5percent in 2004, 95.4 percent in 2005, 93.3 percent in 2006 and 96.0 percent in 2007. In general it showed upward trend. |
| The average mean score of SE (at .978) for Bangladeshi banks was found to be lower than PTE (at .965) over the study periods. The scale inefficiency was .036 while pure technical inefficiency was 0.022. These results suggested that technical inefficiency might be attributable to scale inefficiency rather than pure technical inefficiency. |
| Examining the three groups Group-1 (n=20), Group-2 (n=18), Group-3 (n=15) we observed that the individual efficiency level of banks are increasing group by group. The mean scores of G-1, G-2 and G-3 differed accordingly, in 2001 the mean TE was found 0.939 in G-1, 0.939 in G-2 and 0.933 in G-3. In 2002, it was recorded 0.957 in G-1, 0.962 in G-2, 0.960 in G-3. In 2003 it was 0.929 in G-1, 0.930 in G-2, 0.943 in G-3. In 2004 it was 0.905 in G-1, 0.907 in G-2, 0.925 in G-3. In 2005 it was recorded 0.926 in G- 1, 0.932 in G-2 and 0.954 in G-3. In 2006 it was found |
| 0.899 in G-1, 0.897 in G-2, and 0.933 in G-3. In 2007 it was observed 0.825 in G-1, 0.870 in G-2 and 0.960 in G-3.These indicated that there was no remarkable difference between the mean TE or G-1 and G-2. While the mean TE of G-1 and G-2 were deferring remarkably from G-3 over the years. It should be noted that the efficiency level of first two groups are increasing in starting period and decreasing gradually, while it decreased in the starting of G-3 then increasing gradually. |
| The scale inefficiency was lower in G-3 compare to G-1 and G-2. This indicated that the scale inefficiency was observed decreasing group by group and these are attributable to technical efficiency rather than pure technical inefficiency. From the above discussion we concluded that the efficiency level of third group is higher than the other groups. |
CONCLUSION
|
| Identifying the efficiency levels is a major concern in efficiency analysis. We examined several efficiency measures in Bangladeshi commercial banks during the period 2001- 2007 and detect the difference in efficiency measurement excluding state-owned and then Islamic banks using a data envelopment analysis (DEA). |
| The most important results are summarized below: |
| 1) Initially we derived the relative technical efficiencies of 20 Bangladeshi commercial banks. The analysis result indicated that the average mean score of technical efficiency was 91.1 percent. The sources of inefficiency of the sampled banks were found to be derived from the scale inefficiency rather than pure technical inefficiency. From the year wise technical efficiency of individual bank over the study period, it was observed that the most efficient banks were AL-Arafah Islami Bank Limited, Shahajalal Islami Bank Limited, Eastern Bank Limited, and the less efficient banks over the study period were Janata Bank Limited, Uttara Bank Limited, United Commercial Bank Limited, Pubali Bank Limited, and AB Bank Limited. |
| 2) From the results of Group-2, excluding two state-owned banks, the average technical efficiency was found 91.9 percent. The source of efficiency of the sampled banks was found to be lower for technical efficiency and scale efficiency rather than pure technical efficiency. It should be noted that, the efficiency level of Group-2 were slightly increased from the efficiency level of Group-1. |
| 3) From Group-3, excluding two state-owned and three Islamic banks, the average technical efficiency was observed 94.4 percent. The source of efficiency of the sampled banks was found to be lower for technical efficiency and scale efficiency rather than pure technical efficiency. |
| 4) From three groups, the mean score of first two has on a downward trend and third group has on an upward trend. The efficiency levels were increasing group by group. The technical inefficiency was declined from group to group. The mean score of third group differ largely from other two groups. |
Tables at a glance
|
 |
 |
| Table 1 |
Table 2 |
|
Figures at a glance
|
 |
 |
 |
 |
 |
| Figure 1 |
Figure 2 |
Figure 3 |
Figure 4 |
Figure 5 |
|
 |
 |
 |
 |
| Figure 6 |
Figure 7 |
Figure 8 |
Figure 9 |
|
References
|
- Banker RD, Charnes A, Cooper WW (1984). Some models for estimating technical andscale inefficiencies in Data Envelopment Analysis. Management Sci. 30(9):1078–1092.
- Berger A, Humphrey D (1997). Efficiency of financial institutions: International surveyand directions for future research. Euro. J. of Oper. Res. 98: 175-212.
- Charnes A, Cooper WW, Rhodes E (1978). Measuring the efficiency of decision makingunits. Euro. J. of Oper. Res. 6: 429-444.
- Casu B, Molyneux P (1998). A comparative study of efficiency in European banking.
- Center for financial institutions working papers, Wharton school center forfinancial institutions, University of Pennsylvania, Pennsylvania.
- Chansarn S (2007). The efficiency in Thai financial sector after the financial crisis,Economic analysis working paper. 6(10).
- Debasiah SS (2006). Efficiency performance in Indian banking –Use of DataEnvelopment Analysis. Global Busi. Rev. 7(2): 325 – 333.
- Halkos G, Salamouris D (2001). Efficiency measures of the Greek banking sector: Anon-parametric approach for the period 1997 – 1999. Munich Personal RePecArchive, No. 2858.
- Jemric I, Vujcic B (2002). Efficiency of banks in Croatia: A DEA approach. Croatiannational Bank working papers.
- Luciano E (2007). Bank efficiency and Banking sector development: the case of Italy. Int.Center for Econo. Res. Working Papers Series, No. 5.
- Ozkan-Gunay E, Tektas A (2006). Efficiency analysis of the Turkish banking sector inpre-crisis and crisis period: A DEA Approach. Contemporary Eco. Policy. 24(3):418 – 431.
- Rangkakulnuwat P (2007). Technical efficiency of Thai commercial banks between 2002and 2005. UTCC J. 24(1): 129 – 138.
- Sherman HD, Gold F (1985). Bank branch operating efficiency – Evaluation with DataEnvelopment Analysis. J. of Banking and Fin. 9: 297-315.
- Wu S (2002). Productivity and efficiency analysis of Australian banking sector underderegulation. School of Accounting, Economics and Finance, Deakin University,Australia
|