ISSN: 1204-5357
ISSN: 1204-5357
Sergey G Evsukov*
Central Economics and Mathematics Institute of RAS, Moscow, Russia
Aleksandr V Sigarev
Plekhanov Russian University of Economics, Moscow, Russia
Elena V Ustyuzhanina
Plekhanov Russian University of Economics, Moscow, Russia
Elena V Zaytseva
Plekhanov Russian University of Economics, Moscow, Russia
Visit for more related articles at Journal of Internet Banking and Commerce
Research goal: To develop a mathematical apparatus for evaluation of the different pricing policies of the monopolist company in the market for network goods. Methodology: Combination of the neoclassical theory methodologies, investment analysis, and mathematical modeling. Results: The economic-mathematical model of dynamic pricing in the market for network goods is developed in terms of the supplier monopoly. A comparative evaluation of different pricing policies is carried out based on computer experiment. Conclusions and significance: Two important quality indicators of the investment project on the development, production and after-sales service of network goods, namely, net present value of the project (NPV) and discounted payback period (DPB), show different behavior in time. Maximization of NPV is achieved by using subscription fees as the main source of income, while the challenge of reducing DPB tips the choice in favor of a combination of acquisition cost and maintenance fee. The rationale of scientific novelty. The novelty of the approach lies in (1) consideration in the analysis of the three cost types: investment costs, including sunk costs; current costs for production and sales; and the costs of maintaining the value; (2) the transition from the concept of the “value of the good” (expressed in ruble/unit) to the concept of the “use value of the good” (expressed in ruble/unit/period); (3) taking into account the peculiarities of increasing number of consumers of a good over time (logistic curve); (4) taking into account the number of potential consumers as a factor determining the value of a good; (5) use of the discounted payback period as a supplementary project quality indicator.
Pricing, Network Goods, Network External Effects, Investment Project Development
Network goods are taking a larger place in the contemporary economy and becoming the agents of new lifestyles of the population as well as offering new business opportunities for commercial organizations.
Network good is a good, which provides two important characteristics associated with the economy of scale [1]:
1. The economy of scale of consumer value: The increase in the number of consumers of a network good leads to the increase of its value for other users. For example, the more people use email, the higher is the value of the email account for each individual user [2].
There are direct and indirect network effects. Direct effects are associated with rising product value along with the growth in the number of its users. Indirect effects arise from the development of complementary markets: the larger the proportion of the population using bank cards, the more shops accept these cards, and the higher is their value for the card owners; as the number of consumers of cell phones increases, the number of payment points for mobile communication services increases as well that in turn spurs the growth in the number of subscribers [3].
Network effects can be both positive and negative [4]. In the case of a positive network effect, a user, who acquires a corresponding good, increases the value of this good for others. We can distinguish 4 stages of change in the value of the good to the consumer that is associated with the network development: the origin (minimum value of the good, the good is of interest only for the snobs or the freaks), early growth (the value of the good grows slowly until reaching a critical mass of consumers), rapid growth (in excess of a threshold of critical mass of consumers the proposed product (service) becomes attractive for the broad mass of consumers and demand begins to grow rapidly [5], and the saturation (the value of the good remains unchanged or even decreases in the case of negative network externalities). Negative externalities can be associated with the overloading of user communication channels. For example, a computer network overload or traffic jams.
The economy of scale of consumer value determines the need to promote sales. Among others, through the significant investments in advertising; establishing dumping (zero) price at entry of the product to the market; free granting of additional options; encouraging the creation of social networks; and cooperation with competitors to increase total sales.
2. The economy of production scale is a significant reduction in unit costs (per unit of output) at the expansion of the production volume as a consequence of the high capital and current fixed costs.
Capital costs make up a significant part of the total costs of the supplier and require large volumes of production of the final product to achieve payback. Capital costs may include the costs of research and development (R&D) carried out in order to considerably improve the quality of the final product (increase of the number of options); the creation and maintenance of consumption infrastructure (signal transmitting stations (satellites), fuelling stations for e-mobiles, maintenance, spare parts, etc.); the acquisition of patents and other intellectual property rights, including those obtained through the acquisition of enterprises owning the relevant rights; the acquisition of the specific assets for the production of final products (software products, high-quality sound and video recording devices, etc.); and the refining of new production technologies and after-sales service. At that, the structure of capital costs is dominated by sunk costs.
Current fixed costs are the costs needed to keep the network functioning. They may include costs for maintenance of services infrastructure, including rental of equipment (server), the fee for a domain name, payment of man-hours of software engineers, etc.; promotion of products; lobbying and supporting sectoral (professional) standards enabling to raise the entry barriers for new competitors, as well as to strengthen and maintain positions in the hierarchy of concerned field of market.
At the same time most network goods are characterized by low variable costs. Good example is the software production – the development of a new product in the given market requires huge capital investments, while the costs of future reproduction are reduced to the price of the software carrier [6].
Described effects generate the combination of forces, which leads to increased returns caused by scale economy from both – demand and supply sides [7]. High volumes of production in network markets are not only economically viable in terms of costs, but also make the product more valuable to consumers. Thus, over time and with increasing production (consumption) volumes of the network good, its value to consumer increases, while the unit costs of production, sales, and after-sales services are reduced.
Besides, the network goods have the following characteristics:
3. Complementarity and Commonality: Network good is a complementary good. For example, the music file must be played on the player or other device, the use of software needs hardware, etc. [8]. Because of this there should be certain standards in production of network goods in order to achieve the compatibility of complementary goods [9].
4. A high degree of obsolescence: Network goods are usually produced in knowledge-intensive industries that are associated with the constant appearance of basic and improving innovations. This leads to relatively short horizons in production of a series (version) of the product (life cycle of a specific product). Thus, time becomes a very important factor in pricing.
5. The blocking effect: Network goods are often characterized by a high degree of specificity that increases switching costs for both manufacturers (investment in illiquid assets) and consumers (sunk costs in training to work with certain software products) [10-12]. In addition, the transition to other software products can be paired with the need to convert data stored in a particular format. Finally, very important is the compatibility of software used by members of one social or business network. In other words, investments in network goods can change the bargaining power of the parties (supplier and consumer) and create preconditions for extortion on the part of supplier, which is most often seen in the gradual increase of tariffs for subscription services [13].
The studies of the problems associated with network economy were initiated in the end of XX century along with the development of high technologies and the global Internet as well as emergence of many markets for network goods (web services, file storage, and routers for network connectivity) [14]. The issue concerning monopoly pricing in the market for network goods is reflected in the work of the Cabral et al. [15]. The authors come to the conclusion that the equilibrium price is characterized by a steady tendency to rise in the wake of increase in the number of consumers [15]. Fudenberg et al. [16] consider a model for the pricing in the market for network goods under threat of entry into the market of new producers. They note that the curbing of competition may lead to the establishment of lower equilibrium prices [16]. Various pricing strategies, including the differential pricing strategy, are examined by Ulph et al. [17], while strategies to sell goods in sets are studied in the works of Bakos et al. [18].
In order to explore the possibilities of creation of a portfolio of pricing policies in the market for network goods, the authors have developed an economic and mathematical model of dynamic pricing in the network goods’ market in circumstances where the supplier has a monopoly.
Below are a description of the model and the results of the computer experiment.
The Model of the Network Goods Market under Temporary Monopoly of Supplier
The main assumptions of the model:
1) There is just one supplier in the market (intellectual property);
2) Capital investments in the project are implemented one-time in the zero period;
3) Inflation and risks are taken into account in the discount rate of the project;
4) Supply goods are of the same kind (homogeneous goods);
5) One buyer consumes one unit of a good;
6) The use value of the good depends on the number of its consumers and is the same for all consumers;
7) The supplier’s income can be generated from both single and dual sources: revenues from sales of goods and subscription fees (fee for after-sales service).
The following notations are used in the model:
• K – capital investments in the project (rubles);
• T – the estimated duration of the life cycle of the good (period);
• r – the discount rate;
• N – the maximum possible number of potential consumers of the good (persons);
• αt – the fraction of the total number of potential consumers that use the good in the period of t, t € {1, ... T}, αt≤ 1;
• M – the maximum possible value of good for consumer (ruble/unit/period);
• ÃÂÃÅt – the value of the good for the consumer in the period t (ruble/unit/period), t € {1,..., T};
• Vt – the selling price of a unit of good in the period t (ruble/unit);
• Pt – the subscription fee (service cost) per unit of good in the period t (ruble/unit/period);
• ÃÂÃÂ – current fixed costs associated with the release and distribution of the good (ruble/period);
• B – variable costs associated with the release and distribution of the unit of a good (ruble/unit);
• ÃÂÃÂ – variable costs for after-sales service of the unit of a good (ruble/unit/period);
• Gt – semi-fixed costs of period t, associated with after-sales service (ruble/period).
To describe the model, we use the following dependencies:
The proportion of the good’s consumers in the period t (αt)
It is assumed that the proportion of consumers of the good increases over time:
 (1)
(1)
General requirements to function α_t=f(t) are as follows: it is increasing; positive on the whole interval t ∈ {1,…T} ; the growth is of S-shaped character; the maximum value (asymptote) is less than 1.
The increase in capture rate of potential consumers of network goods is well described by the logistic curve (Verhulst curve) [19]:
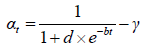 (2)
(2)
where d – is the parameter that specifies the starting proportion of the demand;
b – is the rate of exhaustion of growth potential;
γ – is the parameter indicating the deviation of demand from the maximum possible value.
Accordingly, the number of consumers of the good in the period t is:
 (3)
(3)
The increment of consumers in the period t:
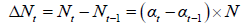 (4)
(4)
Figure 1 shows the logistic function describing S-shaped dependence of the proportion of consumers of the good on time (a), and a function describing the increment of consumers of the good over time (b).

Figure 1: Time behavior of the proportion and number of consumers of the good: a) variation in the proportion of potential consumers (αt) over time; b) the increment of the consumers of good in the period t (Δ Nt) Source: author's elaboration.
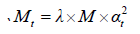
The use value of the good in the period t (Mt).
It is assumed that the use value of the good in each time period depends on the capture rate of potential consumers:
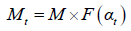 (5)
(5)
The requirements to function are as follows: it is increasing; nonnegative on the entire interval αt ∈ (0,…1}; the maximum value equals to M; the maximum value is reached at the breaking point t0, where αt =α(α<1).
The corresponding dependence can be written as:
 (6)
(6)
On the interval t<t0, where t0 – is the breaking point,

On the interval: t∈ (t0,…1}
The parameter λ is determined on the basis of the maximum capture rate of consumers at which the value of the good reaches its maximum:

Current Costs
Current costs include the costs of release and sale (distribution) of good and costs of after-sales service.
Current costs of the period t of release and distribution of good are:
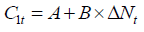 (7)
(7)
Where A – is the current fixed costs associated with the release and distribution of good;
B – is the variable costs for release and distribution of unit of a good.
Current Costs of the Period t for After-sales Service
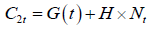 (8)
(8)
Where G(t) – are semi-fixed costs of the period t, associated with after-sales service of the good;
H – are variable costs associated with servicing of the unit of a good.
The amount of semi-fixed costs associated with the service of good is a function of the capture rate of consumers
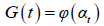 (9)
(9)
Requirements to function are as follows: it is increasing; positive on the entire interval (0 <at< 1); and concave. These requirements are satisfied by a function:
 (10)
(10)
Where G – is the initial (starting) value of semi-fixed costs.
Accordingly:
 (11)
(11)
Total current costs of the period t:
 (12)
(12)
Generation of Supplier’s Income
Income of good’s supplier may be generated in three ways: revenues from selling the good; subscription fee (fee for after-sales service); and both sources together.
The first option is used in conditions where the basic costs of the supplier are associated with the development of good, while the current variable costs for release of the network good are relatively small and the costs of after-sales service are close to zero (software for a wide range of users).
The second option is used in conditions where a significant proportion of the cost is associated with maintaining the value of the good during service life (bank cards, SIMcards, electronic subscriptions, etc.).
A third option occurs when a company intentionally locks the client, forcing him to make investments in specific assets (selling TV program receivers, security alarm system, accounting software, databases, plus after-sales service).
Income from Subscription Fees
Consider the case when the supplier receives income only in the form of a subscription fee.
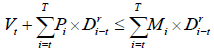
Consumers are ready to pay for the good if the service price does not exceed the value of the good during the relevant period:
 (13)
(13)
where Pt – is the subscription fee for a unit of a good in the period t;
Mt – is the use value of the good in the period t.
Suppose that the company is using its monopoly position and sets a subscription fee at the maximum level, Pt=Mt. Then the income from subscription fees during the period t will be:
 (14)
(14)
Starting from a certain period, the current income sustainably exceeds current cost, and, consequently, the only reason for the cessation of production is the length of the good’s life cycle (the appearance of improved modifications or substitutes).
Sales Revenue
If the supplier receives income only from the sale of good, than the sales revenue in the period t will be equal to:
 (15)
(15)
Where Vt – is the selling price per unit of a good in period t.
The maximum price that consumer is ready to pay for the good purchased in the period t depends on two parameters: the value of the good (in the current and subsequent periods) and the number of future periods of consumption.
Present value of the good for the consumer in the period t will be:
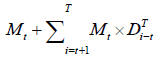 (16)
(16)
Where Vtm – is the upper bound of price in period t;
Dir – is the discount coefficient of period i at a discount rate of r.
Selling price of the good must not exceed the present value of its use for the consumer:

It can be assumed that the monopolist assigns the maximum price calculated in a simplified way:
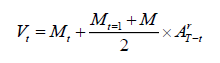 (17)
(17)
Where  – is the annuity for the remaining T
t – periods at the discount rate r.
The price of realization of good is reduced over time. This is due to the reduction of the good’s time-of-use for new purchasers due to the limited duration of the life cycle of the manufactured product.
Income from both sources
In case if the consumer is forced to pay for both the purchase of good and its after-sales service, the supplier's income will be equal to:
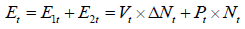 (18)
(18)
For consumer, who purchases the good in the period t, the following condition must be met:
From which:
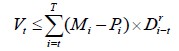 (19)
(19)
While for the consumers, who already have purchased the good:
(20)
If we proceed from the assumption that the fee for after-sales service should be the same for all consumers, we can offer the following price pattern:
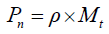 (21)
(21)
Where ρ < 1
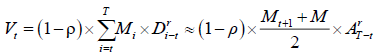 (22)
(22)
Similarly to the case of obtaining income just in the form of subscription fees, in due course, current income begins to exceed current costs. However, due to the fact that the income is received from two sources (paying for the good itself, the user advances the vendor), the breaking point comes a little earlier (Figure 2).

Figure 2: Variations in prices, current revenues and costs in case of selling good and the subscription services. Source: author's elaboration.
Figure 2 shows the curves corresponding to changes in sales prices and subscription fees (a) as well as revenues and costs of supplier in case of receiving income from both sources (b).
The Results of a Computer Experiment
Consider the conditions and risks in achieving the recoupment of an investment project associated with the development, implementation, and after-sales service of network goods in circumstances where the duration of the life cycle of the delivered good is a significant constraint. The main criteria for assessing the quality of the investment project will include net present value of the project (NPV) and discounted payback period (DPB).
A common requirement of recoupment can be written as [20]:
 (23)
(23)
The model was studied on the computer using Excel software environment under the following assumptions (Table 1):
Table 1: The model parameters.
| The number of the good’s life cycle periods (T) | 24 |
| The duration of the period (months) | 3 |
| Nominal discount rate (per annum) (h) | 18 % |
| Expected inflation (per annum) (i) | 11 % |
| The number of potential consumers (N) | 100 000 |
| The starting proportion of demand (d) | 20 |
| The exhaustion rate of the growth potential (b) | 0.3 |
| The deviation of proportion of demand from the maximum possible value (γ) | 0.05 |
| The proportion of consumers, at which the value of the good reaches its maximum (α) | 0.8 |
Source of Income – Sale of Network Good
In case if the revenue from sale of network good is the only source of income, the main costs are typically associated with capital investment (K) and current fixed costs (A). Current variable costs per production of the unit of a good (B) are one-time and not very significant for network goods.
Recall that according to the terms of our model, M – is the maximum value of the good for the consumer (ruble/unit/period). Figure 3 shows the net present value of the project on a cumulative basis under the following assumptions:

Figure 3: The cumulative net present value of the project (sales), mln rubles. Source: author's elaboration.
Thus, under the assumption that the project will be implemented over a long period of time, appropriate investments look quite attractive. The maximum cumulative net present value of the project (NPV) is achieved in the 20th period (5 years) and equals to 640 mln rubles. The project’s discounted payback period (DPB) is less than 9 periods (about 2 years) which means a low degree of risk associated with the rapid obsolescence of the good (the emergence of substitute products).
Source of Income – Subscription Fee
If the supplier’s source of income is just a subscription fee, we must consider the emergence of semi-fixed costs associated with after-sales service of good G(t), as well as the emergence of another type of variable costs – variable costs of the good’s service period (H). At the same time capital investments in the development of good (K), are usually smaller.
Figure 4 shows the cumulative net present value of the project at the following assumptions:
ÃÂÃÅ¡: 100 000 000; ÃÂÃÂ: 10 000 000; G: 20 000 000; M: 2500; B: 500; H: 1000

Figure 4: The cumulative net present value of the project (subscription fee), mln rubles. Source: author's elaboration.
As we can see, under the accepted assumptions with regard to the values of key parameters, the project based on receiving periodic income and bearing periodic costs associated with after-sales service, is less attractive than the project based solely on the replication and sale of good.
Assuming the planned duration of the project is 24 periods or 6 years, NPV reaches 590 mln rubles compared to 640 mln rubles for 5 years in the previous option. Besides, the discounted payback period (DPB) equals in this case 17 periods (over 4 years). And, consequently, the risk that the life cycle of the good will be shorter than planned (the project may last for less than 24 periods) is large enough.
Incomes from Two Sources
As we have noted, a dual source of income (for both the good itself, and after-sales service) has the advantage for the supplier since the investments in the acquisition of the good are often non-returnable, that is, as a result of the buyer's investment in specific assets bargaining power of the parties is changing.
Figure 5 shows the cumulative net present value of the project under the same assumptions as in the case of the income generation only from after-sales service (at ρ=0.8):

Figure 5: The cumulative net present value of the project (two sources), mln rubles. Source: author's elaboration.
Thus, in the case of receiving income from two sources, the net present value of the project (NPV) is somewhat reduced compared to the option of receiving income only in the form of subscription fees (490 against 590 mln rubles). Though, the discounted payback period (DPB) decreases. It becomes by 3 periods less (14 instead of 17) which is a substantial advantage in terms of the risk of emergence of new more advanced versions of the good or substitute products.
Specific features of network goods, namely, the presence of the double economies of scale, necessitate the use of dynamic pricing model that focuses on the increase in the use value of the good with an increase in the total number of its consumers.
Income of good’s supplier can be generated in three ways: revenues from selling the good, subscription fees and a dual income (from both sources).
From a commercial viewpoint, the most attractive is the first option of income, i.e. revenues from sales of the good. However, this option assumes that the supplying company practically does not bear the cost of maintaining the value of the already sold good during the period of its operation. An important conclusion is that in this case it is advisable to stop releasing a good some time before the duration of its life cycle ends.
The choice between the second and third options (solely the subscription fee, or a combination of initial payment and subscription fee) depends on the risks of obsolescence of the good. If these risks are relatively small, we can give preference to the second option (subscription fee). In a more realistic case, it makes sense to use a combination of two methods of receiving income.
Since the conclusions of the model are true only in case of a monopoly of the supplier (this allows the supplier to take the use value of the good as a base for pricing), the risks associated with the emergence of substitute products (obsolescence) are quite high. Therefore, in the context of a significant proportion of the after-sales service costs (maintenance of the good’s value for the consumer) the most preferred is an option of the combined method of receiving income.
Copyright © 2026 Research and Reviews, All Rights Reserved