ISSN: 1204-5357
ISSN: 1204-5357
Faculty of Computer Science, Universitas Dian Nuswantoro, Indonesia
Romi Satria WahonoFaculty of Computer Science, Universitas Dian Nuswantoro, Indonesia
Abdul Razak NaufalFaculty of Computer Science, Universitas Dian Nuswantoro, Indonesia
Catur SupriyantoFaculty of Computer Science, Universitas Dian Nuswantoro, Indonesia
Visit for more related articles at Journal of Internet Banking and Commerce
Prediction customer loyalty is an important business strategy for the modern telecommunications industry in the global competition. Support Vector Machine (SVM) is a classification algorithm that widely used to predict the customer loyalty. SVM in predicting customer loyalty has a weakness that affects the accuracy in the prediction. The problem is the difficulty of kernel function selection and determination of the parameter value. Large datasets may contain the imbalance class. In this study, bootstrapping method is used to overcome the imbalance class. In addition, datasets also contain some features that are not relevant to the prediction. In this study, we propose to use Forward Selection (FS) and Weighted Information Gain (WIG). FS eliminates the most irrelevant features and the computation time is relatively short compared to backward elimination and stepwise selection. WIG is used to weight the each attribute. In order to handle the selection of SVM parameters, we use a grid search method. Grid search method find the best parameter value by providing parameter value range. The experimental results from some combination of parameters can be concluded that the prediction of customer loyalty by using samples bootstrapping, FS-WIG and grid search is more accurate than the individual SVM.
Customer Loyalty; Bootstrapping; Weighted Information Gain; Support Vector Machine
The telecommunications industry is one of the high-tech industry's fastest growing industries among other sectors. The opening of free competition in the company of telecommunications services is also one of the serious challenges faced by the telecommunications industry obliged [1], where the number of competitors in the field of telecommunications, forcing telecommunications companies should further improve customer service in order not to move to the other operator [2], because the cost to acquire new customers is more expensive than maintaining existing customers. With a large market share, many efforts are needed to retain customers that have achieved by the market share did not decrease. Therefore, it is necessary to apply a reliable strategy with a small charge to predict customer loyalty but the results were great can be achieved. Because to get new customers costs more expensive five to six times more than maintaining existing customers [3]. Customers who leave or cease to services already provided by the telecommunications company and become a competitor called the company's customer communications with customer churn behavior [4], this behavior becomes one of the company's revenue losses. It also has become an important issue and one of the major challenges for the company faced in this global era.
Classification is an important research topic in machine learning, because the classification techniques can solve the problem by analyzing the data in the database, each data is grouped into certain classes. Very large data size in the telecommunications company [5] became a major obstacle in achieving the desired performance to predict customer loyalty. There are several techniques to predict customer loyalty that has been conducted by researchers that [1] using Neural Network (NN) [6], Decision Tree (DT) [7], Logistic Regression (LR) [8], Support Vector Machine (SVM) [9]. From the previous studies above, we can conclude that
the neural network has the ability to predict the results of the diagnostic decisions compared with logistic regression algorithm, NN also has the ability to detect complex non-linear relationships between predictor and outcome prediction [10], but the weakness is NN needs large data in the training phase, it is difficult to recognize patterns is using high-dimensional data that requires a long computation time [11] and often experience over-fitting [12]. SVM algorithm can overcome the weaknesses of NN that the problem does not require a large training data and has good generalization ability when applied to data noise [5] which is theoretically more satisfying than neural network method. In addition SVM classification algorithm also has a small risk to the problem of over-fitting compared with other methods [13], but SVM algorithm has a weakness on the difficulty of selecting parameters and optimal kernel function to obtain better approach that can significantly affect the accuracy [9]. So the selection of parameters and functions of proper kernel greatly affect the outcome of the prediction in predicting customer loyalty.
SVM is a classification algorithm that serves to predict customer loyalty, but the application of SVM for predicting customer loyalty has a weaknesses that affect the accuracy in predicting customer loyalty that is difficult kernel function selection and determination of appropriate parameter values, large datasets in general contain the imbalance class, which is a significant difference between the number of classes, which are classes negatives outweigh the positive classroom.
There are several methods to overcome the problem of imbalance class, one of which is the resampling technique [14-16] which collaborated with the selection feature [17,18], therefore, to overcome the problem of imbalance class will be used bootstrapping samples method. After getting the data sampling results bootstrapping, then filter back forward method selection. Forward selection as a feature selection technique which also contributes to handle the high-dimensional data and contains imbalances class [19,20] by selecting the appropriate subset of the original feature set, because not all of the features relevant to the problem, even some of those features actually become a barrier that can reduce accuracy. Selection of the weighting of attributes in this study by using Weighted Information Gain (WIG), because by using the WIG every attribute can be known in value and can choose the best [21], in addition to the WIG is an algorithm that is suitable for use in selecting features the best, especially in the ranks of data [22]. And for the selection of parameters in SVM algorithm using a grid search method. Grid search method is used because it is reliable when applied to the dataset that has an attribute bit [23] rather than random search method.
This study will propose bootstrapping technique, FS-WIG for feature selection and grid search as a selection of parameters in SVM. This study use kernel function Radial Basis Function (RBF), because the RBF kernel parameter C indicates tradeoff in support vector machine algorithm that greatly affect the accuracy [24], some experiments also showed that the RBF kernel generates error rate classification of small and accelerate computational calculations [25], it is most suited to the nature of our large datasets in this study.
In this study proposed bootstrapping resampling method to overcome the class imbalance. In addition dataset also contains features that are not relevant to the feature selection method used in this study, namely the selection of two features Forward Selection (FS) and Weighted Information Gain (WIG). FS serves to eliminate most irrelevant features and require computation time is relative. WIG used to give weight to each attribute value. The purpose of this weighting to rank attributes that meet the criteria (threshold) is determined retained for use by the SVM algorithm. As for the selection of SVM algorithm, parameters by using a grid search method. The grid search method can search for the best parameter value by providing parameter value range. While the kernel functions to be used in this research is by using a kernel function Radial Basis Function (RBF).
Customer Loyalty Prediction
Customer loyalty widely studied and applied by the company, because by knowing the customer loyalty the company can further improve relationships with customers loyal and disloyal, other than that the company can also implement business strategies to win the competition with a competing company. There are several factors in assessing the customer loyalty, including analyzing the classification of the customer lifecycle. Customers are divided into two types, namely customer types and individual employees. Customers consist of employee types of employee insurance, government agencies, the armed forces of the government, transportation and logistics, energy department, education, tourism, hotels and restaurants, Internet bars, hospitals, banks, telecom operators and Internet Service Provider (ISP), party agents and social organizations, manufacturing industry, large enterprises, medium and small businesses). While individual types of customers consist of private customers and customers who are not as clear as customers who live in the city and the customers who live in one country in a certain period [7]. In addition, factors in terms of the length of time in the customer were divided into 3 groups. The first group to be customers of more than 36 months but not more than 60 months, the second group who become customers 18 months but not more than 36 months, the third group being customers of less than 18 months [7]. In this study, some of the main factors into an assessment of customer loyalty consist of [1]:
Demographic Profiles
Perform market segmentation and demographic information containing the possibility of customer behavior. Typically, this information includes age, occupation, gender, and others.
Information of Grants
Some customers have gained some special grants so that their bills are paid in full or in part by third parties. For example, customers who are disabled or over 80 years of age who wish to continue the service.
Customer Account Information
This information includes the type of service package, credit control indicators, indicators of junk mail, the date of first use of the service, date of manufacture, the frequency of billing, account balances, equipment rental, payment type and attributes of the call duration, number of calls and standard prices and costs.
The Historical Information of Bills and Payments
This information concerns the cost of each customer's billing and customer subscription service number in a year.
Complaint Information
Customer complaint is a problem that occurs that harm customers, then submitted to the company. In the studied company, recorded complaints are complaints submitted directly by the company or the complaints that come when customers visited by marketing.
Call Details
In the telecommunications services company, call details refer to the call duration, price and types of calls, such as how often users of local telephone, long distance, international, or whether subscribers are also the products that have been offered internet or other, and the number of customers who use the phone a little bit, service phone SMS little like these are to enter into a group of customers who churn.
Incoming Calls Details
Received call details including call duration and number of calls received, the number of calls changes, changes in the duration of calls received.
Support Vector Machine
SVM concepts can be explained simply as an attempt to find the best hyperplane which serves as a separator are two classes in the input space. Hyperplane best separator between the two classes can be found by measuring the hyperplane margin and look for maximum points. Margin is the distance between the hyperplane to the nearest pattern of each class. The closest pattern is called a support vector.
The data available notated as  while each label is denoted
  for
i=1,2,..,l, where l is the number of data. The classes are assumed to -1 and +1 can
be completely separated by a hyperplane dimension d, which is defined:
for
i=1,2,..,l, where l is the number of data. The classes are assumed to -1 and +1 can
be completely separated by a hyperplane dimension d, which is defined:
 (1)
(1)
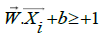
Pattern  which includes class -1 (negative samples) can be formulated as a
pattern that satisfies inequality:
which includes class -1 (negative samples) can be formulated as a
pattern that satisfies inequality:
 (2)
(2)
While pattern which includes class +1 (positive samples):
 (3)
(3)
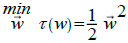
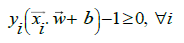
The largest margin can be found by maximizing the value of the distance between
the hyperplane and the closest point, which is  . It can be formulated as a
Quadratic Programming (QP) problem, i.e., finding the minimum point of the
equation, taking into account the constraint equation.
. It can be formulated as a
Quadratic Programming (QP) problem, i.e., finding the minimum point of the
equation, taking into account the constraint equation.
 (4)
(4)
 (5)
(5)
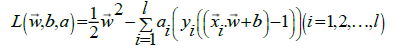
This problem can be solved by a variety of computational techniques, including Lagrange Multiplier.
 (6)
(6)
ai are Lagrange multipliers, which is zero or positive (ai ≥ 0). The optimal value of the
equation can be calculated to minimize L to  and b, and by maximizing L against
ai. With regard to the nature that at the point of optimal gradient L=0, the equation
can be modified as a maximization problem that only contains ai course, as the
equation a below.
and b, and by maximizing L against
ai. With regard to the nature that at the point of optimal gradient L=0, the equation
can be modified as a maximization problem that only contains ai course, as the
equation a below.
Maximize:
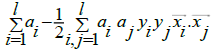 (7)
(7)
Subject to:
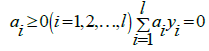 (8)
(8)
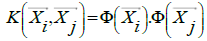
From the results of this calculation are derived i which is ai most positive value. Data were correlated with positive ai is called a support vector. In general, the problems in the real world domains very little data that are linear, most of the data is non-linear. To complete the non-linear case, the calculation of the modified SVM into two stages, where in utilizing a concept called kernel trick. The underlying idea is to transform the data is non-linear and the dimension of the feature space is high enough, then the data on the input feature space can be mapped to the new space, where the patterns on the high probability can be separated linearly. To resolve the problem of non-linear support vector machine is modified to include the kernel trick that converts data on non-linear to linear data. Kernel trick can be formulated with:
 (9)
(9)
Support vector in the above equation is meant by a subset of the training set is
selected as the support vector, in other words the data  corresponding to the ai≥0.
Kernel functions that are usually used in the SVM:
corresponding to the ai≥0.
Kernel functions that are usually used in the SVM:
Linear: K(x,y)=x.y
Polynomial: K(x,y)=(x.y+1)d
Radial basis function (RBF): 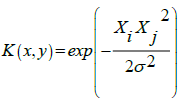
Sigmoid: 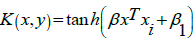 , dimana
Forward Selection
After sampling the dataset, the data is filtered again using a forward selection feature selection methods. Feature selection technique is one of the most important and frequently used in pre-processing, especially for knowledge discovery. This technique reduce the number of features involved in determining a value of the target class, reducing the irrelevant features and the data which led to misunderstanding of the target class that makes the effect for application.
Weighted Information Gain
Weighted Information Gain (WIG) is often used to rank the most influential attribute to class. Gain value of an attribute, derived from the value of entropy before the separation is reduced by the value of entropy after separation. Reduction objective measurement feature information value is applied as a pre-treatment stage before. Only attributes meet the criteria (threshold) is determined retained for use by the classification algorithm [26]. There are three stages in the selection of features using information gain as follows:
1. Calculate the value of the gain information for each attribute in the original dataset.
2. Discard all attributes that do not meet the specified criteria.
3. Dataset revised.
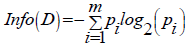
This attributes measurement pioneered by Cloude Shannon in information theory written as:
 (10)
(10)
Where:
D: Association Case
m: Number of partitions D
pi: Proportion of Di to D.
In this case pi is the probability of a tuple in D into the class Ci and is estimated by  2-based log function is taken as information bits based encoded.
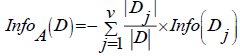
Furthermore, the value of entropy after the separation in the following way:
2-based log function is taken as information bits based encoded.
Furthermore, the value of entropy after the separation in the following way:
 (11)
(11)
Where:
D : The set of cases
A : Attributes
v : The number of attribute partition A
|Dj| : Number of cases in the partition to j
|D| : Number of cases in D
Info(Dj) : The total entropy of the partition
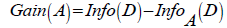
To find the value of information gain attribute A is obtained by the following equation:
 (12)
(12)
Where Gain(A) is Information of attribute A, Info(D) is Total entropy, InfoA(D) is Entropy A with another explanation, Gain(A) is the expected reduction in entropy caused by the introduction of the value attribute of A. Attributes which has been the largest information gain value as the test attribute to the set S. Furthermore, a node is created and labeled with the attribute label, and the branches were made for each value of the attribute.
This study collect two datasets, the first is churn dataset from the database of University of California (UCI) and the second dataset is a Telecom dataset from Customer Relationship Management (CRM) of Duke University. In the Telecom dataset because the original was too large number of records as many as 195,956, then the Telecom dataset will only be taken to record as many as 3,399 (Table 1).
Table 1: Customer loyalty dataset.
| No | Name | Type | Record | Dimension |
|---|---|---|---|---|
| 1 | Churn | Churn | 4,974 | 21 |
| 2 | Telecom | Churn | 3,399 | 6 |
This amount has exceeded the minimum limit for the portion of the ideal as it has been applied in statistical science, whereas the partial dataset can represent the sum of the original population can be defined by the following formula:
 (13)
(13)
Where n is the sample size, N is the ppopulation size, and d is the percentage inaccuracy due to sampling error that can be tolerated.
To overcome the problem of imbalance class, filtering out irrelevant attributes and shortcomings of SVM algorithm, namely the difficulty of determining the value of the parameters and the selection of appropriate kernel function, in this research using the method proposed by bootstrapping, FS-WIG and a grid search on SVM algorithm with a kernel function Radial Basis function (RBF). The proposed method as shown in Figure 1, namely:

Figure 1: Flow diagram of the proposed method.
1. In the first phase is pre-processing, using bootstrapping technique.
2. Perform Forward Selection (FS) to remove the irrelevant attributes and then given a weight to the attributes by using Weighted Information Gain (WIG).
3. Conduct the grid search technique to select the most optimal parameter value of SVM, such as C=0.001-1.5, epsilon=0.004 - 1.5, and gamma 0.001 - 1.5.
4. Divide the dataset by using 5-fold cross-validation into training and testing.
5. Classified the testing data using SVM (LibSVM).
6. The last is the measurement of accuracy and AUC.
In studies in general testing the value of k in the cross validation performed 10 times to estimate the accuracy of estimates, but in this study k values used were 5 or 5- fold cross validation, this is deliberately done because testing with a 5-fold cross validation can speed computational time given dataset used is quite large.
The experiments in this study were conducted using a PC with Intel Core™i3-2330M processor, 2.20GHz, and 6 GB RAM. Performance evaluation is measured using accuracy and Area Under Curve (AUC). We conduct a number of experiments to evaluate the proposed methods. First, we apply bootstrapping on SVM. Second, we employ FS-WIG to select and weight the relevant features on bootstrapped SVM. Thirdly, we apply grid search using 5-fold cross-validation to optimize the parameter selection of SVM. For SVM parameters, we set the C=0.001-1.5, epsilon ε=0.004- 1.5, and gamma γ=0.004-1.5. We also compare the proposed methods with previous research.
Table 2 shows the performance evaluation of the proposed methods on Churn dataset. Based on the experiment, SVM achieves 85.87% in predicting customer loyalty. From the table, bootstrapping technique improve the accuracy up to 87%. When using Bootstrapping and FS-WIG, SVM achieve 91.52% accuracy. The best accuracy is achieved when using Bootstrapping, FS-WIG and Grid Search, the accuracy achieves 93.79%. It is also happening to the Telecom dataset as shown in Table 3. The highest accuracy 99.06% is achieved by SVM when using Bootstrapping, FS-WIG and Grid Search. Based on the comparison with previous research (Table 4), our proposed method outperforms to another model in prediction customer loyalty. Our model achieves 93.79% of accuracy on Churn dataset, followed by Anuj and Prabin [27] with 92.35% of accuracy and Xia and Jin [9] with 90.88% of accuracy. Meanwhile, our model obtained high accuracy on a Telecom dataset with 99.06% of accuracy, followed by Adnan et al. [20] with 92.22% of accuracy.
Table 2: Performance of Proposed Method on Churn Dataset.
| Approaches | Accuracy | AUC |
|---|---|---|
| SVM | 85.87% | 0.504 |
| SVM with Bootstrapping | 87.14% | 0.5 |
| SVM with Bootstrapping and FS-WIG | 91.52% | 0.762 |
| SVM with Bootstrapping, FS-WIG and Grid Search | 93.79% | 0.922 |
Table 3: Performance of Proposed Method on Telecom Dataset.
| Approaches | Accuracy | AUC |
|---|---|---|
| SVM | 97.03% | 0.61 |
| SVM with Bootstrapping | 98.56% | 0.87 |
| SVM with Bootstrapping and FS-WIG | 98.56% | 0.87 |
| SVM with Bootstrapping, FS-WIG and Grid Search | 99.06% | 0.925 |
Table 4: Performance comparison between proposed model and previous researcher.
| Model | Dataset | Accuracy | |
|---|---|---|---|
| Proposed Method | Bootstrapping, FS-WIG and grid search on SVM with RBF Kernel | Churn | 93.79% |
| Telecom | 99.06% | ||
| Anuj and Prabin [27] | Feed-Forward Back-Propagation Neural Network | Churn | 92.35% |
| Xia and Jin [9] | SVM with RBF Kernel | Churn | 90.88%. |
| Adnan et al. [20] | Undersampling PSO, Random Forest and PCA | French Telecom Company | 92.22% |
In this study, a combination of Bootstrapping, FS-WIG and Grid Search was introduced for customer loyalty prediction. Some problem such as imbalance class, irrelevant feature, and parameter selection of SVM were proposed to be overcome. The results of the experiments indicate that the proposed method offer the successful performance in term of accuracy compare to previous researches.
Copyright © 2026 Research and Reviews, All Rights Reserved