ISSN: 1204-5357
ISSN: 1204-5357
Department of Mathematical and Actuarial Sciences, Universiti Tunku Abdul Rahman, 43000, Kajang, Selangor, Malaysia
Azizul Baten MdDepartment of Statistics, Shah Jalal University of Science and Technology, Sylhet-3114, Bangladesh
Mohan Uddin MdSchool of Economics, Finance and Banking, College of Business, Universiti Utara Malaysia, 06010, UUM Sintok, Kedah Darul Aman, Malaysia
Visit for more related articles at Journal of Internet Banking and Commerce
The debate on the stock return predictability of Capital Asset Pricing Model (CAPM) versus Fama French Three Factor Model (FF3FM) is still persistent in the academic literature. The scholarly attention on the FF3FM is seemingly inadequate relative to its return predictability evidenced in several studies. This study compares CAPM versus FF3FM using multiple regression analysis and Thiel’s U2 Test for stock returns in Kuala Lumpur Stock Exchange. Explanatory power of market, size, and growth factors for the time-series expected stock returns is also examined in this study. The results indicate significant improvement of market beta in explaining the stock returns. FF3FM is found to have stronger explanatory power than that of CAPM as the adjusted R2 value of the FF3FM is higher than that of CAPM. FF3FM is found better than CAPM also based on the Thiel’s U2 Test value.
Fama French Three Factor Model; Capital Asset Pricing Model; Risk-Adjusted Return; Kuala Lumpur Stock Market
The risk-return tradeoff is very important to investors and portfolio managers in the estimation of investment risk [1]. The Capital Asset Pricing Model (CAPM) initiated by [2-4] assumes that the Markowitz mean-variance criterion plays its role when the investors choose their portfolios and suggests that, the expected return on the risky asset should exhibit a positive linear relationship with the systematic risk/market risk of the asset. The empirical investigations of the model made a significant contribution in the field of Finance and Econometrics [5]. However, CAPM does not consider many of the other factors that are evidenced by the empirical literature to have relationship with return. Such factors include: earnings to price ratio [6,7], size measured by market capitalization [8], financial leverage [9], and the book to market ratio [10,11].
Many researchers argued for FF3FM as a better model for explaining return and they attempted the comparative studies between the CAPM and FF3FM in various stock markets. Such studies include: [12] in Singapore, [13] in US Stock Exchange, [14] in Italian Stock Exchange, [15] in Indian Stock Exchange, [16] in Taiwan, [17-19] in Istanbul Stock Exchange, [20] in Australian Stock Exchange, [21] in the Shanghai Stock Exchange, [22] in France, [23] in Nigeria, [24] in Amman stock market, and [25] in Pakistan.
Both CAPM and FF3FM have been discussed for their strengths and weaknesses. The predictions of CAPM are straightforward and intuitive. However, the empirical support for the applicability of the CAPM is not very strong, which may be due to either the weakness of the model or the difficulties associated with the implementation of a valid test of the model. On the other side, for explaining stock return, FF3FM considers the size and growth factors, which is not motivated by the investors’ prediction. Some other factors like expected future cash flows are not considered by any of FF3FM and CAPM [26-28].
In 1990s a ‘better’ FF3FM was proposed after highlighting on the weaknesses of CAPM. [29-31] showed in their seminal papers that the premium associated with size and book-to-market factors compensates for non-market risk component. According to ref. [32], the market beta could explain the expected return and risk premium is found positive.
So the question arises why the real world decision makers do not rely on FF3FM instead of CAPM. There may be three possible reasons: the practitioners may not be aware about FF3FM; or it is not cost effective to collect the extra information required for implementing FF3FM; or the practitioners think that FF3FM is not always better than the CAPM.
To sum up, the validity of CAPM is questioned, as some of the empirical evidence did not fully support the full explanatory power of market beta, and some other variables are found to have explanatory power beyond beta. On the other hand, some of the empirical investigation could not explain a significant portion of the return difference by employing FF3FM. Thus, no single model could exhibit a full explanatory power for the stock returns. As a result, practitioners use both CAPM and FF3FM alternatively in their analyses. Therefore, it is necessary to compare CAPM and FF3FM. In this study, an attempt has been made to compare the CAPM and FF3FM in explaining stock returns in Malaysia.
Background of the Study
The stock exchange of Malaysia is currently known as Bursa Malaysia. This exchange was originated in 1930 at the time of establishing the Singapore Stockbrokers' Association as a formal organization for securities dealing in Malaya. Then in 1964, the Stock Exchange of Malaysia was established. Later, on December 14, 1976, the KLSE (Kuala Lumpur Stock Exchange) was incorporated. KLSE continued the operations of Kuala Lumpur Stock Exchange Berhadin the same year. Bursa Malaysia Berhad (BM), the new name of KLSE continued from 2004. Earlier, BM comprised of three divisions, namely, Main Board, Second Board and Malaysian Exchange of Securities Dealing and Quotation Berhad or MESDAQ. BM is still considered to be among the developing or emerging markets in the world as compared to other matured capital markets such as the US and Hong Kong. The number of listed companies of BM grew from 736 in 1998 to 977 in 2008. The market valuation increased from RM375 million in 1998 to RM870 in 2008. According to market demography, institutions dominated the retail trading with 71%, while individual investors trade the balance, 29%. BM underwent two extreme rise and fall during the 1990s. BM was in a super bullish trend during 1994-1996 periods. Later on, it exhibited a bearish trend as a result of the Asian financial crisis during 1997-1998 periods. Currently BM consists of two divisions of the market. First one, the Main Market is for the bigger established companies with three to five year track record of good profits. The second one, called Access, Certainty and Efficiency (ACE) market, is for smaller businesses with future growth prospects. Among the 977 listed companies most (26%) are from the industrials sector, 25% are from the consumer sector, 15.4% are from the financials, 14.1% are from the materials, 11.3% are from the IT sector, and the remaining 8.2% are from the energy, healthcare, Telco, and utility sectors [33]. The current (December, 2013) equity market capitalization amounts to $508 billion, which makes it the fifth fastest growing equity market in Asia [33]. BM is open for trade five days a week from Monday to Friday. Here Table 1 shows the list of studied 58 companies and their respective sectors.
Table 1: List of the companies considered in this study.
| Serial. No | Company Short Name | Sector Name | Serial No | Company Short Name | Sector Name |
|---|---|---|---|---|---|
| 1 | ARAK | Basic Materials | 30 | TGOF | Oil and Gas |
| 2 | ABRI | Industrials | 31 | TAPR | Industrials |
| 3 | AFIN | Financials | 32 | TIEN | Industrials |
| 4 | ASIR | Consumer Services | 33 | TISB | Consumer Goods |
| 5 | AKNT | Technology | 34 | TMBW | Basic Materials |
| 6 | ALRN | Utilities | 35 | TIDO | Telecommunications |
| 7 | MYPB | Financials | 36 | TIME | Technology |
| 8 | ALUM | Basic Materials | 37 | TNTT | Industrials |
| 9 | AMIT | Basic Materials | 38 | TOMY | Industrials |
| 10 | AMCP | Industrials | 39 | WIMB | Technology |
| 11 | AMMB | Financials | 40 | WIDE | Utilities |
| 12 | AMTH | Consumer Goods | 41 | WTKB | Industrials |
| 13 | AMWA | Consumer Services | 42 | WWEN | Industrials |
| 14 | ANAL | Industrials | 43 | XIAN | Consumer Services |
| 15 | ANCO | Basic Materials | 44 | CCMB | Financials |
| 16 | ANNJ | Basic Materials | 45 | YAHO | Consumer Goods |
| 17 | NCKC | Industrials | 46 | YEOH | Consumer Services |
| 18 | APES | Financials | 47 | YILA | Industrials |
| 19 | APHE | Healthcare | 48 | YINS | Industrials |
| 20 | FILE | Consumer Goods | 49 | YLIH | Industrials |
| 21 | ASIA | Financials | 50 | YNHA | Financials |
| 22 | ASIP | Technology | 51 | YOKO | Consumer Goods |
| 23 | PEGI | Financials | 52 | YONG | Consumer Goods |
| 24 | QLRE | Consumer Goods | 53 | YSPH | Healthcare |
| 25 | AYAM | Consumer Services | 54 | BUIL | Industrials |
| 26 | QUAL | Industrials | 55 | YTLE | Technology |
| 27 | RALC | Industrials | 56 | TACO | Financials |
| 28 | UNIP | Consumer Services | 57 | ZECO | Industrials |
| 29 | JERM | Financials | 58 | TRON | Industrials |
Data Source and Selection
The companies listed in the Kuala Lumpur Stock Exchange (KLSE) market were used in this study that covering a period of five years from June 2005 to May 2010. The data of 58 companies, which were listed continually during the sample period in the KLSE market, were considered in this study, because the other companies were traded irregularly or had small trading volumes in that study period.
Monthly return data were used in this analysis instead of daily return data. Because, the daily return data are very noisy and thus experience inefficient estimation [34]. This study selected 60 months (June 2005 to May 2010) as an estimation period, because many studies [30] used an estimation period of 60 months when employing monthly returns.
Description of the Variables
The descriptions of each variable used in the study are stated as follows:
Dependent variable:  = the excess of individual return factor is used as a
dependent variable in the both CAPM and FF3FM.
= the excess of individual return factor is used as a
dependent variable in the both CAPM and FF3FM.
Independent variables:  = the excess market return factor that is used as an
independent variable in the both CAPM model FF3FM.
= the excess market return factor that is used as an
independent variable in the both CAPM model FF3FM.
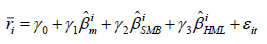
(SMB) = the firm size factor that is used in the FF3FM defined as the difference between the monthly average returns of the small-size stock portfolios and the monthly average returns of the large-size stock portfolios.
(HML) = the book-to-market equity ratio factor that is used in the FF3FM defined as the difference between the portfolio’s average returns on the high book-to-market ratio stock portfolios and the portfolio’s average returns on the low book-to-market ratio stock portfolios. Data were taken from DataStream.
Capital Asset Pricing Model
The CAPM is concerned about how investors determine expected returns, and asset prices, as a function of risk. The Sharpe-Litner CAPM is the extension of one period mean-variance portfolio models of refs. [35,36] with the following assumptions:
(i) Investors choose their investment portfolios based on expected return and variance of return over single period.
(ii) Investors have the homogenous estimates of mean, variance and covariance of all assets.
(iii) The capital markets have no transaction costs.
(iv) All assets are perfectly divisible.
(v) No restriction on short sales.
(vi) Investors can borrow and lend unlimited amounts at a risk free rate.
When an asset’s quantity of risk is measured by its covariance with the market divided by the variance of the market, the CAPM quantifies the market price of risk which is measured by the risk premium [37].
Quantity of risk, beta,
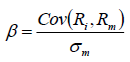
Where,
Cov (Ri ,Rm) =The covariance of the independent variables of Ri and Rm.
Ri =Return on asset i .
Rm =Return on the market,
σm =The standard deviation of the market.
Market price of risk, risk premium is,
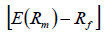
Where,
E(Rm) = The expected return on the market,
Rf = The risk-free interest rate represents one month Treasury bill.
The CAPM can be expressed by adding the risk-free rate in order to measure the expected excess return of an asset as follows:
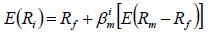 (1)
(1)
Where,
E(Ri) = The expected return on asset i.
E (Rm – Rf) = The expected excess return of the market.
βim =The coefficient or the beta of the independent variable Rm – Rf..
Actual returns are obtained by excluding the expectation symbol E( ) from the eqn. (1) and including the intercept, time subscripts, and a white noise error term ε .
Eqn. (1) of CAPM is estimated using the two stage regression [38]. In the first stage, OLS method was used in the following time series regression model to estimate the systematic risks (beta values) of individual securities:
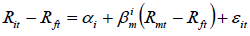 (2)
(2)
Next, in the second stage, the following cross-sectional regression is used:
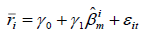 (3)
(3)
Where,  refers to the average excess return of the security i over the whole sample,
  is the estimate of systematic risk contained in a particular company i and are
obtained from the first stage regression in eqn. (2), and
is the estimate of systematic risk contained in a particular company i and are
obtained from the first stage regression in eqn. (2), and  is the regression residual. γ0, and γ1 are the parameters to be estimated.
Fama French Three Factor Model
By adding the traditional CAPM with two more variables, size and book-to-market equity, [11] discovered that the two variables increased the model’s level of explanation of the average stock returns. The two variables are represented by two portfolios namely small minus big (SMB) and high minus low (HML). The three-factor asset pricing model for stocks derived by ref. [29] including the conventional market (beta) factor and two additional risk factors related to size (SMB) and book to market equity (HML) can be expressed as:
 (4)
(4)
Where,
E(Ri) = The expected return on asset i.
E (Rm – Rf) = The expected excess return of the market.
E(SMB) = The expected excess return of the size factor,
E(HML) = The expected excess return of the size factor,
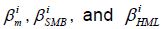 = The coefficients or the betas of the three independent variables Rm – Rf , SMB , and HML .
Actual returns are obtained by excluding the expectation symbol E( ) from the eqn. (4) and including the intercept, time subscripts, and a white noise error term ε.
Eqn. (4) of FF3FM model is estimated by using the following time series regression model.
 (5)
(5)
Then, we run the following cross-sectional regression.
 (6)
(6)
Where, refers to the average excess return for the security i over the whole sample;
γ0,γ1, γ2 and γ3 are the parameters to be estimated.
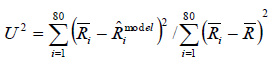
Theil’s U2 Test Statistic for Comparison the CAPM and Fama French Three Factor Model
The Theil’s U2 test statistic is used firstly, for the comparison of the both CAPM with
FF3FM in the time series regression. This test has also been used in other studies such
as [16,39,40]. The Theil’s measure, U2, uses the sum of squared differences of each
stock's average return  from its CAPM or FF3FM from the forecasted return
  as a numerator.
Then it is divided by the sum of the squared differences of average return for each stock from the average return for all stocks . The smaller the ratio, the better the
model forecast is relative to the naïve model. A ratio with a value greater than one
would indicate the inappropriateness of the model. So, the test statistic of ref. [41] is
defined as follows,
. The smaller the ratio, the better the
model forecast is relative to the naïve model. A ratio with a value greater than one
would indicate the inappropriateness of the model. So, the test statistic of ref. [41] is
defined as follows,
 (7)
(7)
Summary Descriptive Statistics
Descriptive statistics of the variables are presented in Table 2. Table 2 shows mean, median, maximum, minimum, and the standard deviation of the variables. Results show that the mean and median of the Excess individual return, excess market return, Firm size factor and Book to Market portfolio are positive, but the minimum of excess individual return, excess market return, Firm size factor and Book to Market portfolio are found to be negative.
Table 2: Summary statistics of excess individual return, excess market return, firm size factor and book to market ratio factor.
| Statistics | Excess individual return (Rit-Rft) | Excess market return (Rmt-Rft) | Size (SMB) | Book-to-Market (HML) |
|---|---|---|---|---|
| Mean | 0.014 | 0.0084 | 0.0095 | 0.0166 |
| Standard deviation | 0.0143 | 0.0456 | 0.0357 | 0.0383 |
| Minimum | -0.0229 | -0.1511 | -0.0434 | -0.0464 |
| Median | 0.0132 | 0.0126 | 0.0031 | 0.0075 |
| Maximum | 0.051 | 0.1388 | 0.1195 | 0.1299 |
| Sample size | 58 Companies | |||
Table 2 presents also that on an average Book to Market equity has a higher premium and Excess market return has lower than the others.
Estimates of Beta for the Individual Companies
Table 3 shows the estimated value of betas for the individual companies. It was observed that the highest beta attainable company was “AFIN” and the lowest beta attainable company was “YONG.” Among the top five companies based on beta, the highest beta attainable company was not the highest return company because its return (Return=0.0425) was smaller than the return of the company MYPB (Return=0.0505). Similarly, among the least five companies based on beta, the lowest beta attainable company was not the lowest return company because its return (Return=0.0052) was higher than the returns of “TIEN” and “TRON”.
Table 3: Estimates of beta for the individual companies.
| Company | AR | Beta | t-test | Company | AR | Beta | t-test |
|---|---|---|---|---|---|---|---|
| ARAK | 0.0132 | 1.5180*** | 4.313 | TGOF | 0.0038 | 0.8730*** | 2.702 |
| ABRI | 0.0142 | 2.6000*** | 7.631 | TAPR | 0.0154 | 0.745 | 1.237 |
| AFIN | 0.0425 | 3.0080*** | 5.891 | TIEN | -0.0009 | 0.3830*** | 3.089 |
| ASIR | 0.0118 | 1.8870*** | 4.32 | TISB | 0.0126 | 0.6350*** | 4.459 |
| AKNT | 0.0208 | 2.9540*** | 6.983 | TMBW | -0.0229 | 0.4240* | 1.399 |
| ALRN | 0.0166 | 2.0440*** | 3.249 | TIDO | 0.0024 | 0.5760* | 1.531 |
| MYPB | 0.0505 | 2.3510*** | 4.383 | TIME | 0.0175 | 1.0520*** | 4.853 |
| ALUM | 0.0233 | 2.3290*** | 6.302 | TNTT | 0.0212 | 1.2710*** | 6.707 |
| AMIT | 0.0196 | 1.5170*** | 4.044 | TOMY | 0.0151 | 1.1840*** | 6.522 |
| AMCP | 0.0044 | 1.2680*** | 8.076 | WIMB | 0.0318 | 1.6090*** | 6.079 |
| AMMB | 0.0124 | 1.7360*** | 4.514 | WIDE | 0.0431 | 0.8550*** | 2.339 |
| AMTH | 0.0211 | 0.9760*** | 4.232 | WTKB | -0.0026 | 0.6560*** | 3.06 |
| AMWA | -0.0195 | 1.9460*** | 5.849 | WWEN | 0.0131 | 1.2920*** | 8.138 |
| ANAL | -0.0009 | 0.8860*** | 3.146 | XIAN | 0.0022 | 0.6520*** | 5.065 |
| ANCO | 0.01 | 0.6680*** | 3.934 | CCMB | 0.0198 | 1.8670*** | 5.934 |
| ANNJ | 0.0075 | 2.1000*** | 7.987 | YAHO | -0.0008 | 0.431 | 1.05 |
| NCKC | 0.0216 | 1.9340*** | 7.99 | YEOH | 0.0215 | 1.2650*** | 4.874 |
| APES | 0.0232 | 1.0770*** | 5.027 | YIKO | -0.0008 | 0.5160*** | 2.811 |
| APHE | 0.0011 | 1.1980*** | 4.945 | YINS | 0.0188 | 0.8800*** | 5.702 |
| FILE | 0.021 | 1.3680*** | 4.32 | YLIH | 0.0109 | 1.0240*** | 5.252 |
| ASIA | 0.0399 | 2.6820*** | 6.719 | YNHA | 0.0119 | 1.1220*** | 4.817 |
| ASIP | 0.0109 | 1.8910*** | 6.708 | YOKO | 0.013 | 0.7160*** | 3.518 |
| PEGI | -0.0056 | 0.7090*** | 4.269 | YONG | 0.0052 | 0.025 | 0.247 |
| QLRE | 0.0317 | 2.2280*** | 7.703 | YSPH | 0.0042 | 0.9210*** | 7.53 |
| AYAM | 0.027 | 1.0610*** | 4.471 | BUIL | 0.015 | 1.0310*** | 6.197 |
| QUAL | 0.0069 | 0.266 | 1.213 | YTLE | 0.0081 | 0.4530** | 1.875 |
| RALC | 0.0046 | 1.4620*** | 3.055 | TACO | 0.0135 | 0.9410*** | 4.372 |
| UNIP | 0.0186 | 2.1790*** | 6.615 | ZECO | 0.0163 | 0.2920** | 2.241 |
| JERM | 0.051 | 0.7800*** | 3.721 | TRON | -0.0074 | 0.4110* | 1.614 |
Note. *, **, *** Significance level at 10%, 5%, 1% consecutively.
Table 3 indicates that the highest return (Return=0.0510) yielding company was “JERM” with β=0.7800 and the lowest return (Return=-0.0229) yielding company was “TMBW” with β=0.4240. These results contradicted with the CAPM’s basic hypothesis for a few companies only but supported for the most of the companies [42].
Significance Level of Beta Estimates
It was found from Table 3. The beta coefficients for 49 individual stocks were found statistically significant at the 1% level of significance, 2 individual stocks were recorded statistically significant at the 5% level of significance and 3 individual stocks were observed statistically significant at 10% level of significance. The remaining 4 companies were noticed statistically insignificant. These findings supported the findings of ref. [42], where they examined 100 companies listed in the Athens stock exchange and found that most of the beta coefficients for individual companies were statistically significant at the 5% level of significance and all estimated beta coefficients were statistically significant at the 10% level of significance.
Regression Results of the CAPM
According to the critical condition of CAPM where CAPM is valid or effective in the stock market, so the intercept term should not be significantly different from zero and the coefficient of beta should be positive and significant. Therefore, a two-tailed test was used for intercept whereas for slope term a one-tailed test was used [43]. From the empirical analysis of CAPM for individual companies in Table 4, the intercept was 0.0021 and it was not significantly different from zero. The value of the intercept indicates that there is a direct relationship between stock return and beta. The result is found consistent with previous studies of ref. [44], in which it showed a positive risk-return relationship. The coefficient of the beta was positive and significant at the 1% level of significance. These findings were fully supported the validity of CAPM in the Malaysian stock market [43]. But, the Adjusted R2 was found comparatively small (0.1993). The explanation to why the adjusted R2 value for the CAPM gets as low as 19.93% could be that CAPM regressions contain more dependent portfolio.
Table 4: Regression results of the CAPM.
| Variables | Parameters | Coefficients | S.E. | t-Value | Adjusted R2 |
|---|---|---|---|---|---|
| Constant | γ0 | 0.0021 | 0.0034 | 0.6131 | |
| Beta | γ1 | 0.0093*** | 0.0024 | 3.8972 | 0.1993 |
Note. *, **, *** Significance level at 10%, 5%, 1% consecutively, S.E: Standard Error.
Regression Results of the Fama French Three Factor Model
Table 5 shows the regression results of the FF3FM in the KLSE market from June 2005 to May 2010. The intercept was found positive and insignificant. All the market factor slopes were recoded positive and significant. These indicate that the market factors are highly related to stock excess return, which plays an important role in explaining stock excess returns [20].
Table 5: Regression results of the Fama French three factor model.
| Variables | Parameters | Coefficients | S.E. | t-value | Adjusted R2 |
|---|---|---|---|---|---|
| Constant | γ0 | 0.003 | 0.004 | 0.864 | 0.230 |
| Beta | γ1 | 0.012*** | 0.003 | 4.247 | |
| SBM | γ2 | 0.009*** | 0.004 | -2.584 | |
| HML | γ3 | 0.005** | 0.004 | -2.076 |
Note. *, **, *** Significance level at 10%, 5%, 1% consecutively, S.E: Standard Error.
The coefficient of beta was significant at the 1% level of significance. The “SBM” coefficient was positive and significant at the 1% level of significance which confirms the existence of the small firm effect. Moreover, the “HML” coefficient was positive and significant at the 5% level of significance which provides the evidence that the Book to Market ratio effect exists in the market. These findings are found consistent with the works of ref. [29]. Both a size effect and a book-to-market equity were existed in the KLSE market. The results show that the added variables (SMB and HML) in FF3FM promoted higher adjusted R2 than that of the CAPM. Results in Tables 4 and 5 indicated that the value of adjusted R2 was increased from 0.1993 in CAPM to 0.230 in FF3FM. Finally, it can be concluded that FF3FM has comparatively greater explanatory power than the CAPM model in the KLSE market.
Results of Theil’s U2 Statistic
The results of the Theil’s U2 statistic in Table 6 are represented for comparing the CAPM with the FF3FM. According to ref. [40], the smaller the ratio, the better the model forecast. Since the ratio was found to be smaller in FF3FM than CAPM in this study, FF3FM provided a better forecasting ability over the CAPM. So, FF3FM outperformed CAPM as a forecasting model in expected return in the KLSE market.
Table 6: Comparison of the models using the Theil’s U2 statistic.
| Model | Test Value |
|---|---|
| CAPM | 0.00000910 |
| Fama French Three Factor | 0.00000888 |
This study investigates whether FF3FM explains the variation of stock return better than CAPM and to test which of the variables (SMB and HML) is more powerful in explaining the variation of the expected returns of the stock market in Malaysia for the period 2005-2010. The most of the beta coefficients for individual companies were statistically significant at the 1% level of significance. Again, from the regression results of CAPM, the beta coefficient was found to be positive and significant at the 1% level of significance. From the regression results of FF3FM, the beta and SBM coefficient were recorded significant at the 1% level of significance, the HML coefficient was observed positive and significant at the 5% level of significance which provided the existence of the small firm and Book to Market effect in the market. The value of adjusted R2 was increased from 0.1993 in CAPM to 0.230 in FF3FM by adding the factors SMB and HML. These findings supported the validity of FF3FM in the Malaysian stock market. While the comparison is made in between CAPM and FF3FM using Theil’s U2 test, it was observed that FF3FM showed a better forecasting ability than CAPM because the lower Theil’s U2 test value of FF3FM implied the greater support to the model. There are areas of research left unanswered as this study did not examine the Inter-temporal CAPM and its ability to explain returns in the KLSE market.
Copyright © 2026 Research and Reviews, All Rights Reserved