ISSN: 1204-5357
ISSN: 1204-5357
Department of Informatics, University of Pretoria, South Africa
Alta Van Der MerweDepartment of Informatics, University of Pretoria, South Africa
Fransonet ReynekeDepartment of Statistics, University of Pretoria, South Africa
Visit for more related articles at Journal of Internet Banking and Commerce
Electronic banking is becoming more popular every day. Financial institutions have accepted the transformation to provide electronic banking facilities to their customers in order to remain relevant and thrive in an environment that is competitive. A contributing factor to the customer retention rate is the frequent use of multiple online functionality however despite all the benefits of electronic banking, some are still hesitant to use it because of security concerns. The perception is that gender, age, education level, salary, culture and profession all have an impact on electronic banking usage. This study reports on how the Knowledge Discovery and Data Mining (KDDM) process was used to determine characteristics and electronic banking behavior of high net worth individuals at a South African bank. Findings indicate that product range and age had the biggest impact on electronic banking behavior. The value of user segmentation is that the financial institution can provide a more accurate service to their users based on their preferences and online banking behavior.
Electronic Banking; Behavior; Data Analytics; Data Mining; KDDM
Increased competition and fast paced technological innovation in financial markets have forced banks to invest in online banking systems and other financial delivery channels to retain competitive advantage, revitalise customer relationship management and give customers the opportunity to perform real time financial actions easily and independent of time and place [1]. Customer behavior differs from user to user which makes it imperative for institutions to get a better understanding of their customer’s comfort levels and desires [2]. Even though internet banking saves time and money some customers are still hesitant to use it because of security concerns [3]. Numerous customers are anxious about losing money while doing online transactions or transferring money over the internet [3]. Organisations need to obtain a better understanding of new technologies and the elements that influence user acceptance of these technologies [4]. Financial institutions need to improve their online service features in order to provide a seamless service to their customers [5]. Numerous modern organisations are exploiting technological progressions to make their services more accessible to their clients [6]. Financial institutions need to understand how customers experience their online services in order to meet their requirements [7]. Banks are one of the organisations who are investing in a number of Information Systems to provide the best online service to their customers [6].
It is more cost effective for banks to retain existing clients than to obtain new clients [6]. Therefore, financial institutions continuously try to encourage customers to stay with them and not move on to their competitors in order to increase their revenue [6]. Banks should form a good relationship with all clients but especially high net worth clients to prevent them from leaving the institution because it can have a negative impact on the bank’s profit lines [8]. To grow the electronic banking customer base, institutions first need to determine if there are any main resemblances and variances between current and potential customers [9]. These resemblances and variances can be determined by segmenting the data in the databases which will highlight the demographics of users and non-users [9]. Examples of demographics that banks can focus on when analysing online service usage are gender, age, education level, salary, culture and profession [6].
A number of organisations are enhancing their data analysis capability by running field experiments to determine if the correlations found by analysing historical data accurately represent casual relationships [10]. Data analysis is done to discover hidden patterns in financial institution’s databases which give them the opportunity to understand the various characteristics of different customers and give them the opportunity to create a better service experience for their customers [11]. Data Analytics give organisations a view of real-time changes in their business settings, customer prerequisites and customer behavior [10]. Data mining is a technique used by organisations to produce innovative knowledge from a big amount of information sources [12]. Gradually companies are realising the advantages of using data mining techniques and are incorporating data mining into their daily activities and resolution processes [9]. Organisations can transform the information created through the data mining process into knowledge and use it to achieve a particular target [12].
The big challenge for today’s financial institutions, which we investigate in this research study, is the ability to integrate various databases to get a cohesive view of their client’s behavior and provide a more personalised online service to their clients. It is challenging to analyze financial institution’s databases to optimise customer behavior management because their databases are multi-dimensional and have large amounts of customer and transactional data [11]. By analysing millions of records of data users, organisations often encounter challenges to transform the data into valuable information as well as knowledge [13]. Data mining helps users and organisations to overcome these challenges [13]. To approach this challenge we have followed the KDDM process model to create data models that were used as a predictive model. The goal of using the KDDM process model is to almost automatically gain innovative knowledge from the existing databases [9].
The next section provide background information on banking services, the competitive environment banks survive in, banking and IT revolution as well as the different electronic banking channels. We also focus on the role of data and the different aspects of data analytics and data mining. At the end of this chapter we discuss the CRISP-DM data mining process model. In chapter 3 we discuss the methodology that we’ve followed. Then we present the results from the KDDM methodology in chapter 4. In the last chapter we summarise our findings and contribution.
It is vital for banks to get a better understanding of what customers’ value and which dimensions to focus on [6]. Research up to this point has indicated that gender, age, education level, salary, culture and profession all have an impact on electronic banking usage but what current researchers have failed to reveal is what is the electronic banking behavior and characteristics of a high net worth individual. In this section information is provided on the context of the study. We start by describing the banking services followed by customer behavior. We then highlight the importance of data within the context of the banking environment by focusing on the potential that data analysis and data mining have to understand our customer better.
Banking Services
Customer’s choice and continuous use of a specific banking service delivery channel is dependent on the customer’s expectation of the value proposition offered by the financial institution [6]. Empowering customers with the option to use technology-based banking systems can be a relatively cost effective way to retain customer loyalty [4].
Clients want more valuable services from their financial institutions and therefore banks need to continuously innovate and match client’s expectations by providing an appropriate, trustworthy and convenient service [14]. It is vital to understand customer needs and desires before an organisation can truly comprehend to customer’s selection of a specific banking channel and continuous usage thereof [6].
Banks aim to offer a range of “self-service channels like Automated Teller Machines (ATM), Internet and Mobile banking” to provide a more suitable service to customers at a reduced rate which will increase profitability [15]. Banks can increase their customer base by providing various distribution channels like branch networks, internet and mobile banking [4]. Banks that use multiple distribution channels can target specific products to the right customer by using demographic segments [4].
Competitive Environment
Banks have in the last five years made a fundamental move from traditional banking to online banking [16]. Distributing electronic financial services is now a competitive requirement and not only a method to attain a competitive lead in the market [15]. Electronic banking facilities give banks the oppurtunity to attain competitive advantage but is also the competititve requirement to survive in the financial world [17]. Electronic banking has changed the way banks operate by bridging geographical and governing gaps and by providing innovative product offerings and financial services [15]. In the current times financial institutions are competing to increase their market share [16]. It is imperative for financial institutions to get a better understanding of customers and their needs or desires [9].
In the competitive financial environment customers become more demanding [18]. To meet and exceed customer expectations as well as to survive in the competitive financial environment, financial institutions have to get a better understanding of the basics that have an impact the customer’s perception of electronic banking services [18]. Financial institutions should not only focus on pre-adoption e-banking behavior but also focus on post-adoption [6]. A better understanding of customer’s electronic banking bechaviour will help financial institutions to create and provide appropriate strategies to enhance e-banking adoption usage [18].
Banking and IT Revolution
To cope with competitiveness a great amount of financial institutions are changing from an out-of-date method of “bricks and mortar” to a “clicks and mortar” [2]. Bill Gates stated that “banking is essential, banks are not”. The banking sector is one of the business sectors who have accepted the transformation to provide electronic facilities to their customers [2]. By adopting the newest technologies banks are empowered to grow their customer base [16]. Significant progression in Information Technology has created a universal revolution in financial institutions [19]. Substantial changes in financial systems are initiated by globalization and financial liberalization [15]. To cater for these changes banking industries have to constantly broaden their service offerings and in return increase their dependency on technology [15]. Banks use different types of technology to acquire a great amount of customers to increase profits [20]. Bankers need to use more persuasive methods to attract customers for better adoption rates [19]. Financial institutions have implemented service providing technology to replicate the banking services traditionally provided by personnel [4]. Banks and customers are interested in directing communication from physical branches to online facilities because they can increase productivity levels and be more profitable [4]. “The paradigm shift in the way companies interact with their customers” is caused by the propagation of technology driven systems especially in the banking sector. Banks need to offer valuable online services to obtain customer devotion as well as obtaining a better reputation in the market [19].
In order to retain international networking and increased productivity in the financial institution market, banks need to promote the adoption and use of online services which will increase sales and improve customer satisfaction levels, interest new customers and preserve existing customer relationships [4] Financial institutions became conscious of the fact that they cannot survive without investing in technology [15]. Technology helps them to manage costs, attract more customers and satisfy customer needs [15]. Banks with larger customer bases can generate more revenue by marketing and communicating customised innovative products and services to specific groups of customers [4].
Electronic Banking
E-banking is used to define numerous computer-based tools that are utilised to provide a banking service [19]. E-banking consist of numerous channels of electronic banking like Automatic Teller Machines (ATM), internet banking and mobile banking [21]. Electronic banking includes a number of services, like automatic teller machines (ATM’s), electronic fund transfers (EFT) and other online and mobile banking functionalities [3]. Electronic fund transfers (EFT) is one of the advantages of internet banking [7]. EFT is the electronic interchange or transfer of funds between accounts of the same or multiple institutions by using an online banking system [7]. Online banking services also include bill and credit card payments, money transfers, enquiry services, account management and investment and insurance management [5]. Electronic banking provides a number of convenient services to their customers who include ease of use, fund transfers; account balances enquiries, cash retrieval and deposits in a timely manner [2]. Electronic banking is used by customers to perform the majority of traditional retail banking services online which include account balance requests, money transfers, bill payments etc., over the internet [3].
E-Banking is used to provide 24/7 banking services to customers [20]. E-banking offers around the clock access to banking facilities and provides information to customers through a digital interface [19]. A great amount of individuals prefer e-banking services because it is available 24 hours a day [18]. Information provided through the online facility should be accurate and correct and should fulfill the customer needs [7]. E-Banking give banks the oppurtunity to provide the same traditional banking services at their branches to the electronic users at a better price [21]. The reduction in costs is one of the main reasons why majority of the financial institutions are investing in electronic banking technologies and attempt to sustain a similar service and customer satisfaction levels [21]. Customers can encounter a number of issues while making use of e-Banking services which should be resolved in a timely manner for a bank to retain their reputation [7]. The user interface is one of the elements that have an impact on satisfaction of e-Banking services [7]. Security is important to meet and exceed customer needs [7]. Privacy and security policies should be in place to satisfy the customer [7]. A major benefit for customers using online banking services is time and cost savings as well as freedom to perform banking activities anywhere [5].
In the current times financial institutions of all sizes are beginning to provide majority of their financial facilities online [18]. Financial institutions have to guarantee that their electronic facilities are simple, convenient and always available to ensure customer satisfaction [19]. e-Banking is reshaping the services provided by traditional banks [20]. Convenient and affordable access to banking services is one of the main reasons for internet banking adoption [19]. Customers of financial institutions are less keen to go to traditional branches and more inclined to use electronic channels which give them the ability to perform banking activities 24 hours a day [5]. Customers can conduct their banking endeavours basically anywhere as long as they are connected to the internet [18]. Users can acquire online services anywhere and anytime they just need an internet connection [5]. E-Banking is transforming the methods customers use to perform banking activities because they don’t need to physically go to the bank to fulfill their banking needs anymore [3]. Electronic banking helps financial institutions to reduce operational and transactional costs, increase the speed of the service and build closer relationships with clients [22]. E-banking cut the cost of retail transactions and increased the effectiveness of banking and payment facilities globally [19]. Electronic banking doesn’t only offer 24 hour services per day but also enables a country to operate internationally [7]. Financial institutions that are making use of E-services can reach more clients and eliminate geographic barriers [22].
Users who accept and adopt online banking have a smaller chance to leave a financial institution, use the banking services on a regular basis, invest in more products and retain greater asset balances [4]. Banks invest in online banking services because it reduce transaction costs, ease integration of facilities, upsurge general productivity of operations and provide collaborating marketing competencies which boost customer attraction and financial revenue [4]. Increased customer comfort ability with digital banking services give financial institutions the opportunity to enter new markets, reduce operational and administrative costs and improve workforce satisfaction [7]. Convenience is part of the primary factors that influence customers to use online services [4]. A factor to gain customer satisfaction is to provide a variety of offerings to customers which are easily accessible by the customers [4]. Electronic banking gives banks the opportunity to meet and exceed customer expectations through making use of enriched interactions, data mining tools and customisation [22]. Electronic Banking is transforming the methods that are used by banking institutions to do business [15].
Internet Banking
Internet banking is a subset of electronic banking [21]. Internet banking can be described as an “internet portal, through which customers can use different kinds of banking services ranging from bill payment to making investments”, this include money transfers, balance requests, paying bills and online wealth management [15]. Internet banking is the use of technology to provide banking and financial facilities through the internet which give customers the ability to make financial transactions by using a financial institution’s devoted website [21]. Some of the most important internet banking elements are accuracy, security, availability, accessibility and assurance in the financial institution and then also their capability to manage objections and personalisation of the customer needs [15]. Confidence and trust in internet banking are two of the most vital influencing aspects to the use of Internet banking [17]. Internet banking includes services like banking enquiry functionalities, bill and credit card payments, money transfers, account enquiries and access to online statements [14].
Some customers don’t approve of internet banking services and rather choose face-to-face communications instead of self-service [15]. A great amount of research has been done to study user perception, approval, fulfilment and attitude towards digital financial services [15]. Customers are afraid that their accounts can be hacked through internet banking [20]. Absence of security and privacy are two of the primary factors that hinders customers to use internet banking [17]. Perceived risk is one of the main inhibitors for internet banking usage and can be described as a customer’s opinion of uncertainty and probable negative consequences of making use of internet banking [3].
Mobile Banking
Mobile banking is part of the innovative banking element which is to make a bank digital [16]. Mobile-banking is an innovative digital banking and communication system which gives customers the oppurtunity to perform financial on non-financial services by using a digital device [1]. Mobile-banking can be seen as amended versions of internet banking which can be accessed by mobile devices at any time and any place [15]. Mobile banking gives customers the ability to access their bank accounts by the use of a mobile device [16]. The increased use of digital devices have increased the need for mobile banking services and will most likely have a substantial influence on the financial market [4]. The progression of mobile banking is remarkable if you compare it with other online banking facilities [16].
Prompt innovations and advantages of digital information systems and technology have amplified the importance of mobile banking and getting a better understanding of customers’ adoption and continuous use of mobile banking services has become vital for financial institutions [1]. Customers are attracted to mobile banking because they have access to banking facilities 24 hours a day and can easily make transactions [16]. Mobile banking facilities include immediate access to real time information and give the customer the opportunity to make real time transactions anytime and anywhere [1]. Customers can use their mobile devices to do banking transactions like balancing enquiries, fund transfers and buying or selling of shares [16]. Mobile banking has become one of the most vital channels for banking because of the easy accessibility [4]. System availability, speed of the system and convenience are some of the primary elements needed to make mobile banking user friendly [7]. Mobile banking facilities are available to everyone regardless of their earning groups [17]. Perceived accessibility and availibility, effectiveness, innovativeness and trust are some of the main elements that influence approval of mobile banking services [17].
Customer Behavior
When financial institutions provide new products or services, the success is influenced by the client’s contentment level towards the specific product or service [23]. Organisations who understand their customers and their behavior can maximise their customer’s lifetime value to the organisation [24]. Customers are demanding a convenient and 24 hour accessible service through different delivery channels [6]. Financial institutions with the objective to attract and retain online customers have to get a better understanding of their customer’s behavior and attitude in order to fulfill their desires and needs [2]. By looking at electronic banking services the banks main business objectives are to get a better understanding of how customers use the variety of electronic banking services and to understand the demographics and behavior of the electronic banking users [9]. At the present time customers have more banking and financial service choices as well as how they prefer to interact with their bank [23]. The main drive of an organisation should be to create and withstand conjointly beneficial relationships with particular customers [25].
Electronic Banking Adoption and Demographics
Financial institutions have the desire to learn more about their customer’s needs and preferences so that they can satisfy all the customer demands [18]. Institutions in the banking sector want to understand the desires and preferences of their customers so that they can fulfill the needs of the customer in a timely manner [18]. E-banking will lessen banks operating costs, increase their profits and provide a more convenient service to their customers [7]. E-banking also gives a bank the opportunity to collect and manage more effective information of their customers [7]. Financial institutions are eager to acquire and retain customers and therefore need to provide innovative and value added online services which will assist banks to increase customer loyalty and satisfaction [1].
Electronic word of mouth gives existing or potential customers the opportunity to post positive or negative declarations about a product or service provided by the financial institution by using the internet [1]. Word of mouth has a substantial impact on the acceptance and use of electronic banking services [1]. When customers are introduced to new technologies, there are numerous factors that influence their decision of how and when they will be using the new technologies [4]. Electronic banking can only be successful if it is accepted and adopted by customers [14]. Online product offerings influence customer attraction [4]. Financial institutions are investing more in online banking and the success of these investments is reliant on customer approval of the online services [9]. Research on adoption and ongoing usage of online services is predominantly relevant for the banking sector because the price to keep a current customer is a fifth of the price than getting a new customer [1].
Banks want to get a better understanding of their users to gain customer retention, and attract more customers [9]. Adoption of electronic banking is grounded on various elements which include security and privacy, innovative characteristics, customer attitude, demographics and computer skills [14]. There are multiple elements that have an impact on the perception of electronic banking facilities specifically demographic and psychographic elements [17]. Demographic factors have an impact on online banking behavior [20]. Kolodinsky, Hogarth and Hilgert states that earnings, education, sex, marital status and age have an impact on adoption of electronic banking [19]. Previous research studies recommend that personal and e-Banking usage demographics like sex, age, earnings and marital status can be associated with the usage of different electronic banking service channels [9]. Younger customers have a higher probability to embrace electronic banking because they are more technological advanced [22]. It is found that a typical user of e-banking services is an educated young prosperous individual with decent computer skills [15]. By personalising customer experience financial institutions can assist their customers to get a better understanding of their needs and provide recommendations based on their demographic details or online banking behavior [4].
Segmentation analysis is a technique which is used to have more targeted communication with clients [11]. The technique place individuals in specific groups based on certain similarities or characteristics [11]. To categorize clients into similar demographical or behavioral segments give financial institutions the ability to efficiently satisfying their customer needs and in return increase revenue [3]. Banks continuously try to find techniques to segregate their offerings and create more suitable facilities for individual market segments to obtain an enhanced relationship with their customers [11]. To reach these goals a number of organisations have collected big amounts of data into large databases, which are then analyzed and used to create innovative business schemes and opportunities [11].
Types of Customers
It is beneficial for a financial institution to have more than one type of customer [26]. A customer is an individual who uses a financial institution’s services for their benefit [26]. Different customers have different needs in their personal or business capacity which gives a bank an opportunity to generate revenue [26]. The needs of individuals differ because of different income levels and their lifestyles [26]. The two core groups of banking customers are individual and business customers [27]. An individual customer can be described as a person who opened a bank account for their own personal capacity [26]. There are several organisations that open bank accounts for their companies and use these accounts to operate their businesses [26]. For banks to survive in competitive environments, they have to look after their primary customers [23]. Customers have different desires and the amount of revenue they produce for the organisation [25].
One of the four dimensions of customer behavior analytics is customer identification, which is the most essential dimension and extensively implemented at financial institutions [24]. Customer segmentation is part of customer identification [24]. “Segmentation in banking is one of the most important business decisions”, because the exercise of creating special collections of products for an exceptional group of clients is at the root of the current method to banking [27]. Organisations can also partition their customer base by focusing on their contributed revenue [8]. Value-based customer segmentation is used to segregate customers based on their profit contribution and is used to prioritize customer interactions [8]. The main goal of segmenting customers is to fulfill customer requirements by reaching all customers and distributing business assets to the most economically operational areas [25].
Segments can be created grounded on clients’ profitability where the highest-profitability clients will be placed in a segment for which all-encompassing retention plans will be created [25]. To survive in the current competitive financial market banks have to create schemes for clients based on their values [25]. A high-value customer should always receive an outstanding service with every interaction they have with the financial institution because they are accountable for a great amount of revenue generated by the bank [8]. A high-value customer should also be comprehensively monitored over time to indicate any sign of decreasing their relationship with the bank [8]. The bank will have to follow appropriate steps to retain these customers [8]. Organisations should effectively obtain new customers and retain existing high profit customers [11].
Role of Data
With the data-driven economy data is a critical benefit for the growth in financial sectors [23]. The amount of data kept at financial institutions is swiftly increasing which give banks the opportunity to do predictive analytics and enrich their business capabilities [24]. “The business intelligence approach regards data as a company’s assets”.
Data mining is used in the financial sector by examining large databases to discover unknown configurations and by automating the method to find predictive information [28]. Banks can perform customer experience analytics to get deeper insights on customer behavior and their preferred banking channels [24]. With a massive amount of consumer data, data mining methods can deliver business intelligence which can create innovative opportunities [28].
Data Analytics and Data Mining
Analytics is analysis of data by using refined quantitative techniques to come to valuable conclusions which traditional Business Intelligence methods are not likely to determine [29]. Data analytics is the process which is used to convert fragmented data of organisations into action-oriented information and knowledge [30]. Data analytics is used by organisations to analyze critical business data which enable them to get a better understanding of their business and environment [31]. Institutions use databases to store user’s personal and personalized information [32]. By analyzing and integrating the user’s personal information institutions can get a more comprehensive view of the user’s needs and offer a better service to the user [32]. They will also be able to categories clients with a higher spending potential and do more accurate target marketing which will improve customer experience and generate more revenue [24]. Analyzed data gives users the opportunity to make better business decisions [30].
Institutions who analyze electronic data can build a user behavior profile which contains attributes like the user’s browsing history, transaction history, sex, profession, earnings age and other demographics [32]. The user behavior profile can be used to provide a more accurate and specialized service [32]. By integrating and analyzing data banks have an opportunity to get a more accurate view on their customer’s preferences [24]. The latest progress in information technology makes it possible to integrate and analyzes millions of records which include personal data [13].
“Data mining is the process of extracting interesting patterns and trends from large datasets”. The foundation of data mining is the method of using technology to get valuable knowledge out of different datasets [33]. It is an advanced method which is used to gain innovative and cherished business insights by analyzing the data stored in the organisation’s databases [12]. Data mining is the exercise of searching through enormous extents of data to discover hidden patterns or trends [29]. Data mining is used to find correlations, relationships or patterns in large amounts of data collected on a regular basis [34]. Data mining tasks are unique because there are a number of different patterns in a big database [12]. The knowledge gained from the analysed data facilitates individuals to make knowledgeable business decisions [12]. Data mining can help a financial institution to create profiles of certain users or customers [12]. By using the profiles financial institutions can target specific offerings to the right customers [13]. Customer segmentation is done by placing customers with similar preferences and characteristics in sub groups which enable banks to personalize banking products and services [24]. Nowadays segmentations include “personality and lifestyle, attitude, behavior, product usage, and purchase pattern variables”. Grounded on the type of pattern needed, “data mining can be classified into summarization, classification, clustering, association and trend analysis”. Data mining has two main objectives which are prediction and description [33]. Prediction involves selecting a few variables that can be used to predict indefinite values of other appropriate variables [33]. Description is focusing on finding human-comprehensible patterns and trends in the data [33].
Data Mining Process Model (CRISP-DM)
CRISP-DM (Cross-Industry Standard Procedure for Data Mining) is created to serve the prerequisite for a proper data mining process model which breaks it down in phases from data to discovering knowledge [9]. The CRISP-DM model is mainly industry-orientated with a main emphasis on the business view [29]. The CRISP-DM model arranges the data modeling process into six different phases [29]. The six phases are: Business Understanding, Data Understanding, Data Preparation, Data Mining, Evaluation and Deployment [9]. The “knowledge discovery via data mining process (KDDM) “is part of the CRISP-DM model which is a multiple phase procedure with the goal to partly automatically extract innovative knowledge from a current database. The KDDM process is collaborating and iterative which includes a big amount of decisions made by the user [12].
The business understanding phase is viewed as the most vital phase of the data mining task because it focus on defining the business goals and business success principles which result in an initial project plan which can be used to reach the goals [29]. In the business understanding phase the objective is to get a more accurate view of the business goals and requirements [9]. The business understanding phase begins with getting a better understanding of the business problem [13]. The business understanding phase includes comprehension of the applicable former knowledge and the goals of the request [12]. The identified goals are then used to select suitable data mining problem categories like “prediction, segmentation, visualization, summarization or link analysis”. For the segmentation category the enactment measures can contain the amount of clusters generated, the size of the cluster as well as how appropriate the cluster description is [9]. Data mining and business experts’ work as a team to determine the project goals combined with the business requirements [13].
The data understanding phase begins with preliminary data collection and carries on by defining and discovering the data, to determine data quality issues and to determine early perceptions of the data [9]. It is vital to discover and understand the different variables in the database, their dimensions and their dissemination [9]. After the preliminary data collection the next step is to start with activities linked to dissemination of the data, these activities include examining data to find the applicable requirements and exploring the data to get primary understandings and validate data quality [29]. The data understanding phase consist of dataset collections and concentrating on a subset of variables or data models which will go through the discovery phase [12]. Domain experts assemble, define and explore the data and also identify any data quality issues [13]. In this phase “traditional data analysis tools” like statistics are implemented to discover data insights.
In the data preparation phase the initial collected data is transformed into the necessary modeling tool format [9]. The goal of the phase is to “select, cleanse, construct, integrate and format the data”.
The data preparation phase includes processes like data collection, deciding on strategies for incomplete datasets and missing or unknown values [12]. The data mining objectives determined in the previous phase requires that the data is in a certain format [9]. Domain professionals create the data model which is used for the modeling phase [13]. The experts assemble, cleanse and format the data to ensure that the data is in the right format and acceptable for the data mining tool [13]. The data preparation phase includes undertakings to prepare the final dataset for modeling, which include data collection, data cleaning, data assembly, data integration and data configuration [29].
In the modeling phase the information gained from the preceding phases will be utilized to classify the group of appropriate data mining techniques [9]. The data mining analyst will need to do sufficient experimentation to determine which techniques will be appropriate [9]. The user needs to derive the purpose of the data mining process from the selected data mining algorithm “(e.g. summarization, classification, regression and clustering)”.
Data mining analysts choose and apply a number of different mining tasks because one problem can be solved by different mining functions and each model should be evaluated by the expert [13]. The steps in the modeling phase can be reiterated with different parameters until optimum outcomes are obtained [13].
In the evaluation phase the best models used in the modeling phase are assessed grounded on the business goals and the ones that are considered as value propositions [9]. Before the deployment phase, the data mining outcomes need to be evaluated to determine if it meets the business success standards [29]. If the final data model doesn’t satisfy the needs of the experts, they return to the data modeling phase and build a new model [13]. An acceptable model can be used to achieve the business goal and incorporate all the business issues [13]. This phase includes interpretation of the discovered patterns and eliminating repetitive or inappropriate patterns and transforming the valuable ones into clear expressions which can easily be understood by the users [12]. The modeling phase is also revised, particularly to check if any vital business matters have been disregarded [29].
The last deployment phase encompasses applying discovered knowledge to models within the business decision-making procedure [29]. In the deployment phase the model results are presented to the decision makers to give them a better idea of the data and to make the models usable in the decision making environment [9]. Data mining experts can integrate the data mining results into a database [13]. The deployment phase is used to evaluate the whole project [29].
In this research study the KDDM process model was followed to create data models that were used as a predictive model. As discussed, the KDDM process model consists of five phases namely:
Phase 1: Business Understanding,
Phase 2: Data Understanding
Phase 3: Data Preparation,
Phase 4: Data Modeling,
Phase 5: Evaluation.
In this section, we described how client demographics and electronic banking behavioral data were collected of a group of high net worth individuals and how we have analyzed the data by following the KDDM phases. This section refers to the different activities part of the KDDM phases. Microsoft SQL Management Studio was used to collect the data from the different databases and Excel and XLSTAT (A Statistical analysis Microsoft Excel add in) were used to integrate and model the data.
Phase 1 - Business Understanding
The first phase consists of activities to establish the business or research objective. As discussed, the financial industry is part of a competitive environment and it becomes vital to get a better understanding of customer needs. With our focus on electronic banking behavior at a financial institution we’ve determined the main business objectives followed by the data mining goals. The specific business and research objectives will be described in the results section [35].
Phase 2 - Data Understanding
The data understanding phase included four activities: collection of the original data, describing the data, exploring the data and verifying the data quality. In this study data was collected from the following four databases: online banking payment database, private bank demographical database, login behavior database and online access database. The variables used from the online banking payment database included the different types of online payments, the date and time of the payments and the selected device used to perform the payment. The variables used from the private bank demographical database included customer demographical details, product details and personal details. The variables used from the login behavior database included the location, time and device used to perform online activities. The variables used from the online access database included the different online features and platforms used by the users and also their device details (Figure 1).

Figure 1: Summary of databases and attributes used in this study.
Phase 3 - Data Preparation
With the third phase all the undertakings concentrate on developing the main dataset that will be the base for the modeling phase. This phase included the following five stages: selecting, cleaning, constructing, integrating and formatting the data. XLSTAT was used to perform the different stages. The four databases mentioned in the data understanding phase all contained a unique Global Client Number variable which was used to integrate the databases and form one dataset.
We followed the data analysis processing steps discussed by [36]:
1. Editing: By editing the collected data we have inspected the raw data. This was done to identify inaccuracies and apply appropriate rectifications. We also assembled the data to assist with the transcribing and tabularization of the data.
2. Coding: By coding the data we have placed the data into a certain amount of groups and categories. These categories enabled us to provide solutions for the research problem. Coding was required for effective data analysis and helped us to acquire critical information.
3. Classification: Classification was used by the researcher to take the large amounts of data and sort it into appropriate groups in terms of mutual appearances. The classification was done based on data attributes.
4. Tabulation: Now that the data was assembled appropriately, we’ve sorted the data in a logical order. Tabulation can be seen as the methodical organisation of data in columns and rows.
By analyzing the data we searched for configurations of relationships between the different data groups. This study focused on casual analysis which is used to determine the effect that one variable has on another variable [36].
Phase 4 - Data Modeling
The activities in the data modeling phase included steps to determine the modeling techniques, creating more than one model, applying the techniques to the integrated data and evaluating the models. Modeling techniques were carefully chosen by focusing on the objectives mentioned in Phase 1.
Several logit models were fitted to the banking data using the XLSTAT statistical analysis package, but one will be reported on. The multinomial logit model with target or outcome variable electronic banking user, divided into three categories, namely only computer online users (including masquerade users), mobile only and mobile/computer users and not online users.
Phase 5 - Evaluation
The aim of research is to back or counter a theory [37]. The main test of a theory is grounded on the statistical examination of the empirical data [37]. Therefore it is vital to develop and test a hypothesis competently with statistical power [37].
The model outcomes created in the previous phase was evaluated by focusing on the objectives described in the first Phase. The models were also evaluated on their prediction capability by splitting the sample size into two and evaluating their predictions.
As discussed the KDDM process model consisted of activities to get a more accurate view of the business and research objectives. In Phase 2 the aim was to collect, describe, explore and verify the data from four databases namely the online banking payment database, private bank demographical database, login behavior database and online access database. Phase 3 was concentrating on developing the main dataset that was used in the data modeling phase. The data modeling Phase (Phase 4) was used to create two models and applying the modeling techniques to the dataset. In the last Evaluation Phase the models created in Phase 4 were evaluated by developing and testing hypotheses. In this section we are presenting results from the different KDDM phases.
Phase 1: Business Understanding
With our focus on electronic banking behavior of high net worth individuals we’ve identified the following business goals:
• To understand the demographics of the users in order to obtain higher customer retention rates and by providing more accurate services and products to customers.
• To create and understand the customer’s electronic banking behavior profiles or segments in order to provide a more accurate and specialised service to the client.
After the business goals have been identified, the data mining goals were determined. By focusing on the business goals, the following data mining objectives were identified:
• Focus on individual demographics to determine the influence each one has on electronic banking usage. Education, gender, marital status, age, profession and product range all have an impact on the use of electronic banking services. The demographics were firstly analyzed individually to understand the impact that each one has on electronic banking usage of high net worth Individuals.
• Segmenting the data to establish electronic banking behavior of high net worth Individuals by looking at the customer demographics and usage information.
• Creating predictive models by focusing on characteristics of electronic usage behavior of high net worth Individuals.
Phase 2: Data Understanding
In this phase we’ve first collected and integrated the data from the online banking payment database, private bank demographical database, login behavior database and the online access database.
This study focused on high net worth individuals of a South African Private Bank. These clients need to have a net asset value or a Wealth and Investment portfolio of at least R25m.
Mobile and Computer Logins and Payments were pulled for six months from March-August 2016. Mobile devices included phones, tablets and iPods. The demographics of the users were divided into computer only users; masquerade only user, mobile & computer users, mobile only users and non-users (see Figure 2 to view the breakdown of number of users per category). Below is a clarification of each group:
• Computer Only Users: These users only used their computers in the last six months to log into the online banking platform and to make an online payment. They could have also logged in without necessarily making a payment. They didn’t use their mobile devices to perform banking activities in the last six months.
• Masquerade Only Users: These users didn’t login with their computers or mobile devices in the last six months. They’ve called the financial institution’s client center in the last six months to make an online payment on their behalf. The client center only used their computers to perform online payments on behalf of clients.
• Mobile & Computer Users: The users in the mobile and computer group used both their computers and mobile devices to perform electronic banking functions in the last six months. They could have logged in with either device without making a payment.
• Mobile Only Users: The mobile only users only used the mobile banking application to log into the online banking platform. They could have logged in with their mobiles without necessarily making a payment. They didn’t use their computers to perform banking activities in the last six months.
• Non Users: These users didn’t use their computers or mobile devices to perform any electronic banking activities in the last six months.

Figure 2: Breakdown of number of users per category.
The private bank products were divided into the following groups: PBA, PBA+1, PBA+2, No PBA+1/2 and No products. A private bank account was used to do transactional banking, a treasury account was used to deposit money with the bank and a lending account was used to borrow money from the bank. Below is a clarification of each group:
• PBA: The user only had a private bank account.
• PBA+1: The user had a private bank account and a lending or a treasury account.
• PBA+2: The user had a private bank account and a lending and a treasury account.
• No PBA+1/2: The user didn’t have a private bank account but had a lending and a treasury account or only one of the two.
• No products: The users have any private bank products.
For this study we’ve integrated data for the following electronic Banking Activities:
Logging in
The user used their web browser on their computers to log in to the online banking platform or the mobile application. After logging in the user either only viewed their financial balances or did other banking activities.
Making a Payment
The computer and mobile payments which this study focused on were Electronic Funds Transfers (EFT) and Value Added Service Payments (VAS). An EFT was used by users to transfer money electronically from one bank account to another. These bank accounts were either at the same financial institutions or different ones. An EFT was further divided into once-off payments and beneficiary payments. A once-off payment was made if the user only wanted to pay the recipient once and didn’t store the recipient’s banking information onto the online banking platform. A beneficiary payment was made to a recipient whose banking details were stored onto the online banking platform. A VAS payment included online payments made to buy airtime, data or SMS bundles for a mobile device through the electronic banking platform.
Use of the Personal Financial Management (PFM) Tool
The PFM tool was used by the users to view and manage all their account (local or international) balances and transactions on one consolidated dashboard. Users could add accounts of their primary financial institution or external institutions. This helped the users to manage their income and spend across all their different accounts.
After we’ve integrated and explored the different variables we had a basic understanding of the data we were working with. The integrated dataset contained information about 4,514 high net worth individuals. As depicted in Figure 3, from the 4,514 individuals 80.3% were electronic banking users. The demographic details of the users were presented in Table 1, which indicated that a total of 34.6% were between the age of 50 and 60. Most users (82.8%) were male, 52.7% were self-employed and only 3.8% were unemployed. Majority of the users (79.4%) were either married or cohabiting. The bulk of the users (86.7%) had a Private Bank Account (PBA) only or a PBA with a lending and or treasury account.

Figure 3: Percentage split of electronic banking users.
Table 1: Demographic profile of different groups of users.
| Variables | Computer Only User | Masquarade Only User | Mobile and Computer User |
Mobile Only User |
Non User | % | All Users | |||||
|---|---|---|---|---|---|---|---|---|---|---|---|---|
| Freq. | % | Freq. | % | Freq. | % | Freq. | % | Freq. | Freq. % | |||
| Age | ||||||||||||
| <30 | 9 | 0.4% | 0.00% | 18 | 1.24% | 1 | 2.08% | 3 | 0.34% | 31 | 0.69% | |
| 30-39 | 79 | 3.8% | 0.00% | 148 | 10.16% | 4 | 8.33% | 25 | 2.81% | 256 | 5.67% | |
| 40-49 | 454 | 22.0% | 10 | 18.18% | 511 | 35.07% | 14 | 29.17% | 160 | 17.96% | 1149 | 25.45% |
| 50-60 | 739 | 35.8% | 16 | 29.09% | 464 | 31.85% | 12 | 25.00% | 331 | 37.15% | 1562 | 34.60% |
| >60 | 782 | 37.9% | 29 | 52.73% | 316 | 21.69% | 17 | 35.42% | 372 | 41.75% | 1516 | 33.58% |
| Gender | ||||||||||||
| Female | 379 | 18.4% | 13 | 23.64% | 219 | 15.03% | 12 | 25.00% | 154 | 17.28% | 777 | 17.21% |
| Male | 1684 | 81.6% | 42 | 76.36% | 1238 | 84.97% | 36 | 75.00% | 737 | 82.72% | 3737 | 82.79% |
| Employment Status | ||||||||||||
| Retired | 283 | 13.7% | 12 | 21.82% | 136 | 9.33% | 2 | 4.17% | 89 | 9.99% | 522 | 11.56% |
| Salaried Employee | 613 | 29.7% | 20 | 36.36% | 554 | 38.02% | 18 | 37.50% | 236 | 26.49% | 1441 | 31.92% |
| Self Employed | 1093 | 53.0% | 21 | 38.18% | 715 | 49.07% | 24 | 50.00% | 527 | 59.15% | 2380 | 52.72% |
| Unemployed | 74 | 3.6% | 2 | 3.64% | 52 | 3.57% | 4 | 8.33% | 39 | 4.38% | 171 | 3.79% |
| Marital Status | ||||||||||||
| Divorced/Seperated | 121 | 5.9% | 9 | 16.36% | 71 | 4.87% | 3 | 6.25% | 55 | 6.17% | 259 | 5.74% |
| Married/Cohabiting2 | 1639 | 79.4% | 36 | 65.45% | 1163 | 79.82% | 37 | 77.08% | 708 | 79.46% | 3583 | 79.38% |
| Single | 223 | 10.8% | 5 | 9.09% | 191 | 13.11% | 4 | 8.33% | 87 | 9.76% | 510 | 11.30% |
| Widowed | 55 | 2.7 | 3 | 5.45% | 24 | 1.65% | 2 | 4.17% | 20 | 2.24% | 104 | 2.30% |
| (blank) | 25 | 1.2% | 2 | 3.34% | 8 | 0.55% | 2 | 4.17% | 21 | 2.36% | 58 | 1.28% |
| Products | ||||||||||||
| Lending and Treasury | 11 | 0.5% | 0.0% | 4 | 0.3% | 0.0% | 4 | 0.4% | 19 | 0.4% | ||
| Lending Only | 43 | 2.1% | 0.0% | 6 | 0.4% | 0.0% | 93 | 10.4% | 142 | 3.1% | ||
| No Products Currently | 82 | 4.0% | 0.0% | 36 | 2.5% | 0.0% | 73 | 8.2% | 191 | 4.2% | ||
| PBA and Lending | 220 | 10.7% | 10 | 18.2% | 159 | 10.9% | 6 | 12.5% | 55 | 6.2% | 450 | 10.0% |
| PBA and Treasury | 786 | 38.1% | 16 | 29.1% | 642 | 44.1% | 16 | 33.3% | 118 | 13.2% | 1578 | 35.0% |
| PBA Only | 613 | 29.7% | 21 | 38.2% | 309 | 21.2% | 20 | 41.7% | 370 | 41.5% | 1333 | 29.5% |
| PBA, Lending and Treasury | 243 | 11.8% | 7 | 12.7 | 281 | 19.3% | 5 | 10.4% | 17 | 1.9% | 553 | 12.3% |
| Treasury Only | 65 | 3.2% | 1 | 1.8% | 20 | 1.4% | 1 | 2.1% | 161 | 18.1% | 248 | 5.5% |
Phase 3: Data Preparation
During this phase all the undertakings concentrated on developing the main dataset that formed the base for the modeling phase. In the data understanding phase it was realised that the degree specialised in had more than a 100 different values; as a result these were divided into nine possible categories. The recognised target variable from the dataset was the multinomial variable Electronic Banking User because part of our objectives is to determine and understand the characteristics of an electronic banking user. The variables highest qualification level and location were included in the initial analyzes but didn’t have a noteworthy effect on the target variable so were excluded.
The variables age, gender, employment status, marital status and product range all contributed to electronic banking usage. The contribution of each variable will be discussed in the sections below.
Age
By comparing the electronic usage within age categories the following observations were made. Users younger than 40 years of age were using mobile and computer devices for electronic banking activities. The age category 40 to 49 years was divided between computer only users and a blend of computer and mobile users. The older generation, 50+ years of age, tend to only use their computers to perform electronic banking activities. What was also interesting was that the majority of the no-users and masquerade only users were older than 50 years. Unexpectedly the majority of the mobile only users were older than 40 years.
Users who were older than 60 years logged in with their computers more than 60 times on average over six months. The popular age group for mobile logins was between 30 and 49 with an average of 55 logins per user over six months.
The 40-49 year old mobile only users were the most common mobile payments age group with an average of 13 mobile payments over six months. They preferred mobile beneficiary payments. Masquerade only users with ages between 50 and 60 made approximately 35 masquerade payments in a six months’ time frame. The bulk of the computer payments were made by users between 40 and 49 and older than 60 years of age. They made approximately 30 beneficiary or once off computer payments per user over six months with 80% being beneficiary payments. The ratio of computer vs. mobile payments for users in the 30-39 age category was approximately 65% vs. 35% where all other age groups were approximately 80% vs. 20%.
The average values of computer payments per age group ranged from R315K-R662K and the average value of a mobile payment per age group was between R34K and R150K. Users between the ages of 30-39 made the highest average computer and mobile payments with a value of approximately R662K and R150K. Users younger than 30 years made the highest average masquerade payment to the value of R12M, the other age groups average masquerade payments ranged from R1.3M-R2.6M.
Users between the age of 40-49 made approximately 1.1% more payments than logging in with their computers. Users in the younger than 30 years age group logged in about 4 times more than making payments on their mobile devices. The mobile login vs. payment ratio was on average 3:1 for the other age groups.
Gender
The average computer logins over six months for female vs. male were 34 vs. 38 where mobile average logins for males were almost double compared to females with a ratio of 8:15.
Females made approximately 15% more computer payments than logging in compared to males who logged in about 11% more than making computer payments. Males made mobile payments about a third of the time they have logged in where females made payments more than half the time. The average mobile payment of a female was approximately R77K which were about 66.8 percent of a male’s average mobile payment. Females tend to make bigger average masquerade payments with an average value of R2.2M.
More male users were enrolled for the Personal Financial Management online tool than females with a low average of about 20% (Table 1).
Employment Status
The biggest group of no electronic banking users was self-employed or unemployed. 49% of the retired users were computer only users. Majority of the salaried employees were computer only or mobile and computer users. Half of the mobile only users were self-employed.
Salaried Employees had the most computer logins with an average of 47 logins over six months where unemployed users had the lowest average. Compared to the other employment groups retired users logged in surprisingly the most with their mobile devices with an average of about 56 times across six months.
Unemployed users made 10% more computer payments than logging in which was the highest percentage for all groups and logged in 45% more with their mobile devices than making a mobile payment. Unemployed users made the lowest average computer payments with a value of R172K. Self-employed users made the biggest average mobile payments with an average value of R128.5K.
Approximately 24% of the salaried employees used the Personal Financial Management (PFM) online tool. Users in the medicine industry had the highest amount of PFM users with an average of 30%.
Marital Status
The biggest group of mobile only users was married or cohabiting with an average of 77%. An average of 40% of all marital status groups are computer only users. Widowed users logged in the most with their computers with an average of 68 logins over six months and the least with their mobile devices with an average of 30 logins over six months.
Widowed users made the most computer payments with an average of 67 payments over six months. Single users made the biggest average computer and masquerade payments with averages of R490K and R2.1M. With VAS payments the single users formed the bulk again with an average of 17 VAS Payments over six months. Divorced and Separated users made the biggest average VAS payments with an average of R302.40.
Product Range
In the No Electronic banking users group 63% of the users had no private bank account (PBA) but a lending or treasury account. Approximately 40% of the users with a PBA and lending or treasury account were part of the mobile and computer user group. Users with more than one banking product including a private bank account had the highest average computer and mobile logins of 56-67 computer logins and 47 mobile logins over 6 months.
Users with a Private Bank account and one or more other products made the most computer and mobile payments over six months with an average ratio of 73:26 payments per user. Users who only had a PB account made the largest average computer payments with a value of R408K. Surprisingly users with no PB account but a treasury or lending account made the biggest mobile and masquerade payments with average values of 159K and R3.8M.
Users with only a PB account had the lowest average mobile payment login ratio, they only made mobile payments 23% of the time that they’ve logging in. Users made approximately 10% more payments than logging in when they had a PB Account combined with a treasury or lending product.
Phase 4: Data Modeling
The purpose of this section is to estimate a few models to determine the factors that have an effect on electronic banking for the high net worth individuals at a private bank in South Africa.
The predictor variables and descriptive statistics used are summarized in Table 1. The demographic variables that made no significant contribution to the model were excluded: Marital status, Branch Code and Race.
The guidelines with respect to the minimum observations to variable ratio are 10 to 1. It was decided to preserve a large proportion of the data set for model building purposes, because of the large number of categorical predictors, some with several categories. A sample of 3614 (80% of total) was randomly chosen for the model building dataset. The validation dataset was formed with the remaining 20% (900 users).
Multinomial Logistic Regression
A multinomial logistic regression model was fitted to the data where the dependent
variable had three categories: 1=Computer and Mobile, 2=Computer Only and 3=No
User. In this model baseline-category logit models are fitted. For example, the model
estimating the log-odds of using Computer and Mobile relative to being No User
(baseline) is given by: 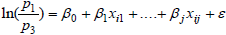 .
.
Where  , is the value of the jth covariate/predictor for the ith respondent and pi=Probability (Falling in category i).
Note that:  .
.
Maximum likelihood estimates, b1, b2,…, bj, were calculated for the parameters .
.
The estimates were then used to calculate the odds of using Computer and Mobile relative to being No User and is given by:
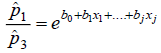
A one unit increase in xj, when keeping all other covariates constant, will result in the
odds changing by a factor of  . This value can also be interpreted as the odds ratio
representing the odds that the person will use both Computer and Mobile devices
(relative to being No User) if the covariate has value (xj+1), compared to the odds
when the value of the covariate is xj when keeping all other covariates constant. If
the odds ratio is less than 1, the outcome event is less likely to occur and if the odds
ratio is greater than 1, the outcome event is more likely to occur.
. This value can also be interpreted as the odds ratio
representing the odds that the person will use both Computer and Mobile devices
(relative to being No User) if the covariate has value (xj+1), compared to the odds
when the value of the covariate is xj when keeping all other covariates constant. If
the odds ratio is less than 1, the outcome event is less likely to occur and if the odds
ratio is greater than 1, the outcome event is more likely to occur.
Similarly models are fitted for  and
and  in the multiple regression models.
The latter can also be derived from the first two.
in the multiple regression models.
The latter can also be derived from the first two.
The banking theory behind the analysis can be summarised by the following model: Logit (Electronic banking)=f(Age, Products category, UK OLB Platform, SA IWI Platform, PFM, Employment Status, Highest Qualification, Gender).
The multinomial logistic results are presented in Table 2 (XLSTAT output). For the
null hypothesis,  , the likelihood ratio chi-square (-2LL) can be used to test if
the model is significant. The multinomial model is significantly (p<0.0001) better than the intercept only model.
, the likelihood ratio chi-square (-2LL) can be used to test if
the model is significant. The multinomial model is significantly (p<0.0001) better than the intercept only model.
Table 2: Estimated model parameters.
| Source | bj-Value (S.E) | Wald Chi-Square | Odds ratio | Odds ratio (95% Confidence Interval) |
|---|---|---|---|---|
| Computer Only User relative No User | ||||
| Intercept | 0.998 (0.403) | 6.123* | ||
| Age | -0.021 (0.005) | 17.072*** | 0.98 | (0.97; 0.989) |
| UK OLB Platform Enabled-0 | 0.000 (0.000) | |||
| UK OLB Platform Enabled-1 | 1.788 (0.357) | 25.145*** | 5.976 | (2.971; 12.02) |
| SA IWI Platform Enabled-0 | 0.000 (0.000) | |||
| SA IWI Platform Enabled-1 | 0.942 (0.138) | 46.613*** | 2.566 | (1.958; 3.363) |
| Employment Status-Retired | 0.000 (0.000) | |||
| Employment Status-Salaried Employee |
-0.481 (0.195) | 6.062* | 0.618 | (0.422; 0.907) |
| Employment Status-Self Employed |
-0.393 (0.179) | 4.82* | 0.675 | (0.475; 0.959) |
| Employment Status- Unemployed |
-0.446 (0.308) | 2.094 | 0.64 | (0.35; 1.171) |
| Products Cat-No PBA + 1/2 | 0.000 (0.000) | |||
| Products Cat-No Products | 0.736 (0.23) | 10.197** | 2.087 | (1.329; 3.279) |
| Products Cat-PBA | 1.297 (0.149) | 75.608*** | 3.66 | (2.732; 4.903) |
| Products Cat-PBA+1 | 2.361 (0.158) | 224.384*** | 10.601 | (7.783; 14.437) |
| Products Cat-PBA+2 | 3.076 (0.294) | 109.812*** | 21.668 | (12.189; 38.518) |
| PFM-0 | 0.000 (0.000) | |||
| PFM-1 | 1.111 (0.233) | 22.637*** | 3.037 | (1.922; 4.799) |
| Highest Qualification-Bachelor’s degree | 0.000 (0.000) | |||
| Highest Qualification- Certificates and diplomas |
0.331 (0.368) | 0.809 | 1.393 | (0.677; 2.866) |
| Highest Qualification-Doctor of Philosophy | 0.643 (0.659) | 0.952 | 1.903 | (0.523; 6.927) |
| Highest Qualification-Honors degree |
-0.417 (0.195) | 4.598* | 0.659 | (0.45; 0.965) |
| Highest Qualification-Master’s degree |
-0.055 (0.277) | 0.04 | 0.946 | (0.55; 1.628) |
| Highest Qualification-Other Qualification |
-0.331 (0.129) | 6.603* | 0.718 | (0.558; 0.924) |
| Highest Qualification- Postgraduate certificates and diplomas |
-0.397 (0.543) | 0.534 | 0.673 | (0.232; 1.949) |
| Gender-Female | 0.000 (0.000) | |||
| Gender-Male | -0.287 (0.144) | 3.954* | 0.75 | (0.565; 0.996) |
| Mobile and Computer User relative No User | ||||
| Intercept | 1.936 (0.486) | 15.895*** | ||
| Age | -0.069 (0.006) | 139.375*** | 0.933 | (0.923; 0.944) |
| UK OLB Platform Enabled-0 | 0.000 (0.000) | |||
| UK OLB Platform Enabled-1 | 2.39 (0.36) | 44.021*** | 10.91 | (5.386; 22.101) |
| SA IWI Platform Enabled-0 | 0.000 (0.000) | |||
| SA IWI Platform Enabled-1 | 1.271 (0.149) | 73.124*** | 3.565 | (2.664; 4.771) |
| Employment Status-Retired | 0.000 (0.000) | |||
| Employment Status-Salaried Employee | -0.78 (0.225) | 12.015** | 0.458 | (0.295; 0.713) |
| Employment Status-Self Employed | -0.71 (0.208) | 11.589** | 0.492 | (0.327; 0.74) |
| Employment Status-Unemployed | -0.782 (0.361) | 4.706* | 0.457 | (0.226; 0.927) |
| Products Cat-No PBA + 1/2 | 0.000 (0.000) | |||
| Products Cat-No Products | 1.364 (0.335) | 16.612*** | 3.913 | (2.03; 7.54) |
| Products Cat-PBA | 2.001 (0.242) | 68.425*** | 7.394 | (4.602; 11.877) |
| Products Cat-PBA+1 | 3.399 (0.244) | 194.588*** | 29.933 | (18.567; 48.257) |
| Products Cat-PBA+2 | 4.339 (0.349) | 154.623*** | 76.6 | (38.658; 151.783) |
| PFM-0 | 0.000 (0.000) | |||
| PFM-1 | 1.848 (0.237) | 60.949*** | 6.347 | (3.991; 10.093) |
| Highest Qualification-Bachelor’s degree | 0.000 (0.000) | |||
| Highest Qualification-Certificates and diplomas | 0.505 (0.396) | 1.627 | 1.658 | (0.762; 3.604) |
| Highest Qualification-Doctor of Philosophy | 0.767 (0.704) | 1.186 | 2.153 | (0.541; 8.564) |
| Highest Qualification-Honors degree | -0.065 (0.213) | 0.094 | 0.937 | (0.618; 1.421) |
| Highest Qualification-Master’s degree | -0.056 (0.308) | 0.033 | 0.946 | (0.517; 1.73) |
| Highest Qualification-Other Qualification | -0.149 (0.147) | 1.034 | 0.861 | (0.646; 1.148) |
| Highest Qualification-Postgraduate certificates and diplomas | 0.385 (0.578) | 0.444 | 1.47 | (0.473; 4.568) |
| Gender-Female | 0.000 (0.000) | |||
| Gender-Male | -0.13 (0.166) | 0.617 | 0.878 | (0.635; 1.215) |
| Mobile and Computer User relative Computer Only User | ||||
| Intercept | 0.938 (0.381) | 6.051* | ||
| Age | -0.048 (0.004) | 127.13*** | 0.953 | (0.945; 0.961) |
| UK OLB Platform Enabled-0 | 0.000 (0.000) | |||
| UK OLB Platform Enabled-1 | 0.602 (0.11) | 29.783*** | 1.826 | (1.471; 2.266) |
| SA IWI Platform Enabled-0 | 0.000 (0.000) | |||
| SA IWI Platform Enabled-1 | 0.329 (0.087) | 14.215** | 1.39 | (1.171; 1.649) |
| Employment Status-Retired | 0.000 (0.000) | |||
| Employment Status-Salaried Employee |
-0.299 (0.156) | 3.664 | 0.741 | (0.546; 1.007) |
| Employment Status-Self Employed |
-0.316 (0.146) | 4.696* | 0.729 | (0.548; 0.97) |
| Employment Status- Unemployed |
-0.337 (0.272) | 1.528 | 0.714 | (0.419; 1.218) |
| Products Cat-No PBA + 1/2 | 0.000 (0.000) | |||
| Products Cat-No Products | 0.628 (0.329) | 3.648 | 1.875 | (0.984; 3.572) |
| Products Cat-PBA | 0.703 (0.24) | 8.59* | 2.02 | (1.262; 3.233) |
| Products Cat-PBA+1 | 1.038 (0.233) | 19.811*** | 2.824 | (1.788; 4.46) |
| Products Cat-PBA+2 | 1.263 (0.25) | 25.469*** | 3.535 | (2.165; 5.773) |
| PFM-0 | 0.000 (0.000) | |||
| PFM-1 | 0.737 (0.098) | 56.677*** | 2.09 | (1.725; 2.532) |
| Highest Qualification-Bachelor’s degree | 0.000 (0.000) | |||
| Highest Qualification- Certificates and diplomas |
0.174 (0.229) | 0.581 | 1.19 | (0.76; 1.863) |
| Highest Qualification-Doctor of Philosophy | 0.124 (0.371) | 0.111 | 1.132 | (0.547; 2.34) |
| Highest Qualification-Honors degree |
0.352 (0.142) | 6.121* | 1.422 | (1.076; 1.879) |
| Highest Qualification-Master’s degree |
-0.001 (0.2) | 0 | 0.999 | (0.676; 1.478) |
| Highest Qualification-Other Qualification |
0.182 (0.102) | 3.213 | 1.2 | (0.983; 1.464) |
| Highest Qualification- Postgraduate certificates and diplomas |
0.782 (0.424) | 3.406 | 2.186 | (0.953; 5.015) |
| Gender-Female | 0.000 (0.000) | |||
| Gender-Male | 0.157 (0.117) | 1.808 | 1.17 | (0.931; 1.471) |
Note: *p<0.05, **p<0.001 and ***p<0.0001. x2=1314.833, p<0.0001 and Pseudo R2(Nagelkerke)=0.361
The target variable had three categories, Computer only user, Mobile and Computer user and No user. XLSTAT is treating the No user category as the reference group. Eight predictor variables were included in the model and they all made a significant contribution to the model.
The value in the odds ratio column gives an estimate of the odds ratio of being in a particular category of the target variable (mobile and computer, computer only and no user) relative to the reference category for a unit increase in the corresponding forecaster, when the rest of the variables are held constant.
The contribution of each of the eight predictor variables will be discussed in the sections below.
Age
If a user’s age increases by one year, the odds of being in the computer only group is 1.05 times more likely than the mobile and computer group. In general if a user is 10 years older, the odds are 10.5 times more likely to be in the computer only group. The odds ratios (1.02 and 1.07) are similar for being in the no user group versus the two electronic groups. This implies that younger users are more likely to be electronic users and the younger a user the more likely that he/she will also use a mobile device.
Products
The odds of being in the mobile and computer group versus the computer only group is 3.535 times higher for PBA +2 than for No PBA +1/2; the odds of being in the mobile and computer group versus the no user group is 76.6 times higher for PBA +2 versus No PBA +1/2 and the odds of being in the computer only group versus the no user group is 21.668 times higher for PBA +2 versus No PBA +1/2. As depicted in Table 2 the other combinations of products had similar odds ratios. The products variable was one of the strongest predictors to separate the electronic users and no users. The more products a user have at the bank, the higher the probability to be an electronic banker and in particular a mobile and computer user.
UK OLB Platform
The odds of being in the mobile and computer group versus the computer only group is 1.826 times higher for UK OLB Platform users; the odds of being in the mobile and computer group versus the no user group is 10.91 times higher for UK OLB Platform users and the odds of being in the computer only group versus the no user group is 5.976 times higher for UK OLB Platform users. The UK OLB Platform is a very important predictor for falling within the mobile and computer group.
SA IWI Platform
The odds for the two electronic groups versus the no user group are slightly lower than the odds for the UK OLB Platform (Table 2). SA IWI Platform users are more likely to be in the electronic banking groups.
PFM
Users with a personal financial manager (PFM) are 2 times more probable to be in the mobile and computer versus computer only group; more than 6 times more probable to be in the mobile and computer versus no user group and 3 times more probable to be in the computer only versus no user group. PFM is a vital variable to predict a mobile and computer user.
Employment Status
Although there were some significant values of odds ratios relating to highest qualification, no clear pattern could be seen in the use of computer or mobile for banking when considering this predictor variable.
Highest Qualification
The odds of being in the no user group compared to any of the electronic groups were lower for individuals in any employment group (salaried, self-employed or unemployed) compared to individuals who were retired.
Gender
Gender was not significant for the mobile and computer group relative to the no user group. The odds of being in the computer only group relative to the no user group is estimated to be 1.33 times higher for females compared to males.
CHAID Analysis
A CHAID (Chi-square Automatic Interaction Detection) analysis was done to complement the multinomial logit model that was fit and not used to do prediction. The same target (dependent) variable was used as for the multinomial logit model.
The graphical representation in the dendogram on 3 levels is shown in Figure 4. The target variable was electronic banking (Mobile and computer, Computer only and No user). The distribution of the target variable can be seen in the node statistics. The main concepts of the decision tree were nodes (parent and child) and branches and the steps were splitting and stopping. All the predictor variables in Table 1 were used. The sample size of n=4514 was reduced to n=4437, because of missing values for marital status.

Figure 4: Three level dendogram (Mobile and computer, Computer only and No user).
An outstanding advantage of the CHAID analysis is that the relationship between electronic banking and for example products can be imagined with a tree image.
Figure 4 provided the following information: At the first level we have the target variable named electronic banking, with three categories namely computer only (47%), mobile and computer (34%) and no user (19%). On the next level is products divided into 5 categories based upon the differing values of products. Products are the predictor that has the greatest impact on the likelihood of an electronic user. The majority of users with PBA only is in the computer only group, PBA +1 is 23% in the computer only and 18% in the mobile and computer group and PBA +2 users are equally divided between computer only and mobile and computer users.
In general all users were divided into 16 subgroups from parent to child nodes through different branches. By using the decision tree in Figure 4, researchers can identify combinations of predictors that establish the highest or lowest risk for a condition of interest. For example 13% of the computer only users are without a UK OLB platform or PFM in the age category 49.5-99 years and have PBA +1 product.
The Chi-squared test statistics for Table 3 was highly significant (p<0.0001), with a large effect size (Cohen’s v=0.35), which confirmed the close relationship between age and electronic banking groups. The discrepancy between the observed and expected number of users in each cell in the cross tabulation as quantified by the standardized residual is of particular interest.
Table 3: Contingency table of age categories versus electronic banking groups.
| Groups | ||||||
|---|---|---|---|---|---|---|
| Computer only | Mobile and Computer | No User | Total | |||
| Age | <30 | Count | 9 | 19 | 3 | 31 |
| Expected Count | 14.5 | 10.3 | 6.1 | |||
| % of Total | 0.20% | 0.42% | 0.07% | 0.69% | ||
| Std. Residual | -1.5 | 2.7 | -1.3 | |||
| 30-40 | Count | 79 | 152 | 25 | 256 | |
| Expected Count | 120.1 | 85.4 | 50.5 | |||
| % of Total | 1.75% | 3.37% | 0.55% | 5.67% | ||
| Std. Residual | -3.8 | 7.2 | -3.6 | |||
| 40-50 | Count | 464 | 525 | 160 | 1149 | |
| Expected Count | 539.1 | 383.1 | 226.8 | |||
| % of Total | 10.28% | 11.63% | 3.54% | 25.45% | ||
| Std. Residual | -3.2 | 7.3 | -4.4 | |||
| 50-60 | Count | 755 | 476 | 331 | 1405 | |
| Expected Count | 732.9 | 520.8 | 308.3 | |||
| % of Total | 16.73% | 10.54% | 7.33% | 34.60% | ||
| Std. Residual | 0.8 | -2 | 1.3 | |||
| >60 | Count | 811 | 333 | 372 | 1516 | |
| Expected Count | 711.3 | 505.4 | 299.2 | |||
| % of Total | 17.97% | 7.38% | 8.24% | 33.59% | ||
| Std. Residual | 3.7 | -7.7 | 4.2 | |||
| Total | Count | 2118 | 1505 | 891 | 4514 | |
| % of Total | 46.92% | 33.34% | 19.74% | 100.00% | ||
Age is separated by a solid black line into electronic banking usage of younger versus older users. The positive standardized residuals of 2.7, 7.2 and 7.3 in the mobile and computer group column in Table 3 indicated that many more of the younger users than expected, (in the age categories <30, 30-40 and 40-50) preferred both mobile and computer electronic banking. An opposite result (negative standardized residuals) was observed for users in the computer only and no electronic user groups. The negative standardized residual of -7.7 in the mobile and computer group column in Table 3, indicated that far less older users than expected, (>60 years) preferred mobile and computer electronic banking. Again older users (>60 years) preferred computer only or no electronic banking at all. In a nutshell, users younger than 50 years preferred mobile and computer online banking and users older than 60 years favoured computer only or no electronic banking whatsoever. An interesting comment is that 78.9% of the No user group was older than 50 years.
Phase 5: Evaluation
This phase was used to evaluate the output of the models based on the business and research objectives described. The first business/research objective was focused on getting a better understanding of the demographics that had an influence on electronic banking behavior. By analysing the data mining results it was clear that age had an impact on electronic banking usage and it implied that the younger users were more likely to be electronic users. The user’s product range was one of the biggest influencers. When a user had more products at the bank they made use of electronic banking and especially a combination of mobile and computer platforms. The biggest part of the no users group was users who had no private bank products. Users who had invested in UK and SA private bank products were mostly computer and mobile banking users. Users with SA Wealth and Investment accounts were more likely to use electronic banking than not. Most of the users who made use of the personal financial manager (PFM) functionality were mobile and computer banking users. Gender didn’t have a significant impact on electronic banking usage.
The second business/research objective focused on segmenting the data to establish electronic banking behavior of High Net-worth Individuals by looking at the customer demographics and usage information. The data was segmented into the three electronic banking usage categories namely Computer Only User, Mobile and Computer User and No User. In the Computer Only User segment majority of the users were between the age of 49 and 99 and had a private bank SA account combined with a lending or treasury account. None of them had a wealth and investment or Private bank UK product and only 4% of the computer only users used the Personal Financial Management (PFM) tool. In the Mobile and Computer User segment most of the users were between the age of 40 and 60 and had a PBA treasury and or lending account. Out of the 35% of users in the Mobile and Computer user segment who used PFM, more than half of the users were below 50 years of age. In the No User segment almost half of the users had only a Private Bank account where the biggest part of the other half had no Private Bank Account but had a lending or treasury account. Basically all the users in the No User segment didn’t had a Wealth and Investment or Private Bank UK account and were older than 50 years. All the No Users who were older than 50 years didn’t use the PFM tool.
The last research objective was to create predictive models by focussing on characteristics of electronic usage behavior of High Net-Worth Individuals. The model aims to predict computer only users more accurately (70.25%) than mobile and computer users or no users Table 4. The model predicts 56% of the responses correctly. By using the validation sample of n2=900 the model’s overall accurate prediction increased to 60.67% Table 5. The model found it difficult to separate the two electronic groups.
Table 4: The classification of the training sample (n1=3614).
| From/to | Computer Only User | Mobile and Computer User | No User | Total | % Correct |
|---|---|---|---|---|---|
| Computer Only User | 1190 | 319 | 185 | 1694 | 70.25% |
| Mobile and Computer User | 608 | 555 | 38 | 1201 | 46.21% |
| No User | 402 | 24 | 293 | 719 | 40.75% |
| Total | 2200 | 898 | 516 | 3614 | 56.04% |
Table 5: The classification of the validation sample (n2=900).
| From/to | Computer Only User | Mobile and Computer User | No User | Total | % Correct |
|---|---|---|---|---|---|
| from S to | 314 | 69 | 41 | 424 | 74.06% |
| Computer Only User | 148 | 151 | 5 | 304 | 49.67% |
| Mobile and Computer User | 89 | 2 | 81 | 172 | 47.09% |
| No User | 551 | 222 | 127 | 900 | 60.67% |
The reason for the low overall prediction percentage could be that the characteristics of the two electronic groups were very similar. One electronic group used computer only and the other group used a combination of mobile and computer. A binary logistic model with target variable categorised as electronic user or not, was fitted to the data. The training and validation samples were identical to those used for the multinomial logit model. The binary model’s overall prediction was 83.12% for the training sample and 85.33% for the validation sample, which confirmed our expectations. It is clear that the model predicted the Computer only users 70.25% correct. The overall prediction is almost 56.04%. If a binary logistic regression was used to estimate Online versus Not Online usage it is clear that the classification tables changed (Tables 6 and 7).
Table 6: The classification of the binary training sample (n1=3614).
| From/to | Not Online | Online | Total | % Correct |
|---|---|---|---|---|
| Not Online | 66 | 106 | 172 | 38.37% |
| Online | 26 | 702 | 728 | 96.43% |
| Total | 92 | 808 | 900 | 85.33% |
Table 7: The classification of the binary validation sample (n2=900).
| From/to | Not Online | Online | Total | % Correct |
|---|---|---|---|---|
| Not Online | 238 | 481 | 719 | 33.10% |
| Online | 129 | 2766 | 2895 | 95.54% |
| Total | 367 | 3247 | 3614 | 83.12% |
The multiple models give a decision maker the opportunity to view the data from more than one perspective. These models also assist to understand the characteristics of electronic banking users which can be used to target the no users.
The aim of this study was to explore the electronic banking behavior and characteristics of a high net worth individual and to determine if the characteristics and behavior can be segmented and used to create business value. This study focused on high net worth individuals who should always receive an outstanding service in every interaction they have with their bank because of their large revenue contribution.
Data was collected to get a better understanding of their payment and login behavior, their demographical characteristics and their online access. The data was analyzed and mined by applying the Knowledge Discovery via Data Mining Process to the integrated data.
In viewing each demographic individually it was clear that age and product range had the biggest impact on electronic banking behavior. It is also evident that clients who are transactional account holders are more likely to make use of electronic banking. The study also showed that younger users were more likely to be electronic banking users and this could be attributed to the fact that they are more technologically advanced.
The segmentation of the data into three main electronic banking groups namely Computer only Users, Computer and Mobile Users and No Users has provided insight into the following outcomes. Computer only users are generally the older users and have a private bank and lending or treasury account. The mobile and computer users were a little bit younger but also had a private bank and a lending and or treasury account and the users in the mobile and computer group who were using the Personal Financial Management tool were below 50 years of age.
By comparing these two segments to the No Electronic Banking group it is clear that the no users usually only have a private bank account or no private bank account but a lending or treasury account.
Target marketing can be used by the financial institution to target the no electronic banking user group with an incentive to apply for a private bank account or a lending and treasury account which will drive electronic banking usage. The financial institution can use these electronic banking segments to provide a more accurate and specialized service to their high net worth customers.
We thank the financial institution who gave us the opportunity to analyze and mine their data.
Copyright © 2024 Research and Reviews, All Rights Reserved