ISSN: 1204-5357
ISSN: 1204-5357
Yogesh Patel
School of Computing and Digital Media, London Metropolitan University, London, UK
Karim Ouazzane
School of Computing and Digital Media, London Metropolitan University, London, UK
Vassil Vassilev
School of Computing and Digital Media, London Metropolitan University, London, UK
Jun Li
School of Computing and Digital Media, London Metropolitan University, London, UK
Visit for more related articles at Journal of Internet Banking and Commerce
The reliability and performance of fraud detection techniques has been a major concern for the financial institutions as traditional fraud detection models couldn’t cope with the emerging new and innovative attacks that deceive banks. This paper proposes a conceptual fraud detection framework that can detect anomalous transaction quickly and accurately and dynamically evolve to maintain the efficiency with minimum input from subject matter expert. Based on the proposed framework,we implement Long Short-Term Memory (LSTM) based Recurrent Neural Network model for detecting fraud in remote banking and evaluate its performance against SVM models. Two novel features for remote banking fraud are evaluated, i.e., the time spent on a page and the time between page transitions. Modeling is performed on an anonymised real-life dataset, provided by a large financial institution in Europe. The results of the modeling demonstrate that given the labeled dataset both the LSTM and SVM model can detect payment fraud with acceptable accuracy, though overall the LSTM models perform slightly better than the SVM models. The results also prove the hypothesis that the events across banking channels can be modeled as time series data and then sequence-based learners such as Recurrent Neural Network (RNN) can be applied to improve or reduce the False Positive Rate (FPR) and False Negative Rate (FNR).
Financial Services; Payment Fraud Detection System (PFDS); Recurrent Neural Network (RNN); Long Short-Term Memory (LSTM); Support Vector Machines (SVM)
Fraud has always been a major issue for the financial institutions. According to the new figures published by Financial Fraud Action (FFA) UK, the financial fraud losses rose by 25% in two recent consecutive years [1]. There are many different types of fraud such as lost and stolen, Card Present (CP), Card Not Present (CNP), counterfeit and account takeover, as defined by Action Fraud UK [2]. Remote banking or online banking related fraud recently causes high concern in financial sector with more sophisticated mobile banking development and the continuous rise of fraud in remote banking.
This paper develops a remote banking fraud detection framework consisting of Feature Engineering and intelligent algorithms, and subsequently implements and tests the framework based on LSTM and a real-life dataset from a European bank. The rest of this paper is structured as follows. Section 2 reviews the techniques and recent development in remote banking fraud detection. Section 3 develops a novel remote banking fraud detection framework based on Feature Engineering and Machine Learning algorithms and section 4 presents the scenario datasets, model simulation, results and discussions. The conclusions and future work are provided in section 5.
Recent work on malware detection [3-5] suggests that the malware propagation continues to increase at an alarming rate with the increase of Internet use. These attacks are very risky for remote banking as the consequence results in loss of money and damage of reputation to banks. One possible attack of remote banking is account taking over which happens when an installed malware manipulates an online banking session to steal security code and account credentials or in the worst case to place fraudulent transfers or altering genuine transfers [5]. Banking specific malware such as Zeus is the most significant financial malware created so far both in terms of its effectiveness and infection rate. Zeus can steal data by logging keystrokes and it spreads copies of itself to other computers via instant and email messages. Once successfully planted, hackers can control and monitor infected devices to obtain access to unauthorized data such as online accounts and credentials [3].
Several anti-phishing approaches have been proposed. Most of them apply one of three techniques, i.e., feature-based, blacklist-based and content-based [6]. Other than Machine Learning, Fuzzy Logic and Data Mining techniques are also applied to assess e-banking phishing website risk based on multiple characteristics and factors [7,8]. The fuzzy logic uses linguistic variables to represent key phishing characteristic indicators. The proposed method has been tested on publicly available datasets such as the “PhishTank” from the phishtank.com and “Phishing Archive” maintained by the Anti-Phishing Working Group. About 606 e-banking phishing websites were collected from The PhishTank database and 100 sample attacks were also collected from the Phish Archive. A cognitive walkthrough was applied to extract features that can classify and categorize the different e-banking phishing attacks. The analysis resulted in defining six e-banking phishing web site criteria.
Credit card fraud is another type of banking fraud which involves unauthorized activities to make payment using a credit card in an electronic payment system as a fake source of fund. The purpose of credit card fraud is to obtain money or make payment without owner permission [9]. There are four types of credit card fraud, i.e., bankruptcy fraud, behavioral fraud, application fraud, and theft or counterfeit fraud. Credit card fraud is also classified as no card present fraud and card present fraud. There are different ways of committing credit card fraud. Fraudsters can generate valid credit card numbers and expiry dates using software [10]. Key logger and sniffers are also used to steal credit card information.
The fast development in the payment ecosystem has led to new threats as cyber criminals have established new and innovative attacks to deceive banks and genuine customers. Therefore, the efficient and accurate fraud detection has become urgent and pertinent, particularly in the banking sector. Several classifiers such as linear regression, K-Nearest Neighbor, Decision Trees, Naïve Bayes, Support Vector Machines and Artificial Neural Networks have been applied to detect fraud [11]. However, these existing machine learning techniques suffer from low detection accuracy and high false positives when fraudsters change their tactics and new fraud Modus Operandi (MOs) emerges [12]. In addition, the task of detecting non-fraudulent transactions is getting more complex as normal behavior of customers is constantly evolving.
The use of classical approaches to fraud detection such as an expert rule-based approach couldn’t keep pace with evolving fraud [13]. Machine learning techniques such as Neural Networks, Hidden Markov Models and logistic regression have been applied in detecting banking fraud [14,15]. There are two ways of applying machine learning for banking fraud detection, i.e., supervised and unsupervised. The main challenge of machine learning techniques for fraud detection is the availability of real-world data.
Khan et al. [9] used an evolutionary Simulated Annealing algorithm to train the Neural Networks for Credit Card fraud detection in a real-time scenario. The technique was evaluated using real world financial data taken from UC Irvine (UCI) repository. This dataset contains useful information about the transaction and contains 20 attributes and values. According to the experimental result, 65% of total fraud cases were classified correctly. Unfortunately, the false rejection and false acceptance rates were not included in the result for further detailed performance. This technique is different from other techniques of machine learning since it used nature inspired heuristic optimization technique to select automatically optimal parameters of the neural network.
Bayes probabilistic techniques are also popular for detecting fraud due to their ability to account additional quantitative measures to improve the predictions. For example, the Bayes Minimum Risk (BMR) technique was improved using calibrated probabilities to correctly estimate individual transactions expected costs [16]. To evaluate the performance of the proposed method, a real credit card fraud dataset provided by a large European card processing company was used. The dataset was labelled as legitimate and fraudulent transactions and was recorded between January 2012 and June 2013. The authors claimed that using calibrated probabilities followed by Bayes minimum risk significantly outperforms using just the raw probabilities with a fixed threshold or applying Bayes minimum risk with them in terms of cost and false positive rate.
Aburrous et al. [17] proposed an automated and real-time anomaly prevention using advanced transaction exploration. The main component of this technique is a feature extraction that combines both intrinsic and network-based attributes. It uses the RFM (Recency-Frequency-Monetary value) framework [18,19] complemented with demographic information of the transaction to define intrinsic features. To test the proposed approach, a unique dataset of approximately 3.3 M transactions from a large Belgian credit card issuer were used. It was claimed that the proposed method improved the Area Under Curve (AUC) score and accuracy, particularly the random forest algorithm.
The reviewed literature showed the importance of building and learning deep hierarchies of features to resolve problems such as breaking down the unknown factors of variation in the input space resulting in poor generalization [20]. The current challenges in the Neural Networks are around optimization that needs to be further researched [21]. The concerns around learning rate, the effectiveness of regularisation, the number of hidden layers and the number of neurons per layer, etc. also require a deep understanding of the architecture. Rare research has been carried out in using Neural Networks concepts to detect fraudulent transactions in financial intuitions. The research showed one such empirical evidence where a deep learning model is used for fraud detection by PayPal [22], without providing any detail on the actual architecture or feature learning aspects. Therefore, a study is required to understand if Neural Networks and deep learning related techniques such as unsupervised learning for automatically discovering data representation or even combination with supervised learning can detect fraud and improve the detection rate.
Several research studies [23-26], have highlighted that a Recurrent Neural Network (RNN) is capable to be applied in the fraud detection domain, however, none of the literature use the RNN to detect remote banking fraud. Furthermore, a lot of research has been carried out on the image and video processing using multi-dimensional RNN as they form a directed acyclic graph that generalizes well for multidimensional data [24] which could be also useful for fraud detection.
Another challenge in applying machine learning technique for fraud detection is the availability of dataset. Firstly, there is a lack of real dataset for remote banking transactions for various reasons including privacy issues. Secondly, it is very difficult to find matching labelled datasets across several channels - for example, transactional data matched by clickstream data for remote banking.
This paper focuses on fraud detection models in the context of remote banking. It develops a conceptual framework and proposes a sequence learner, i.e., LSTM based recurrent neural network model, and traditional Support Vector Machines (SVM) technique for analyzing multidimensional banking transaction data and contextual information to detect fraudulent payment transactions. Then, it evaluates the sequence leaner’s generalization performance against the traditional SVM technique in fraud detection in a remote banking context. In this study, a real-life dataset is provided by a European Bank, with this highly unbalanced dataset fraud labelling for 0.172% of all transactions.
The purpose of the conceptual fraud detection framework is to facilitate the development of Payment Fraud Detection System (PFDS) that can detect anomalous events quickly, accurately and can dynamically evolve to maintain the efficiency with minimum input from subject matter expert. The overview of the framework is depicted in Figure 1.

Figure 1: Remote banking fraud detection framework.
As shown in Figure 1, the framework has two main components, i.e., Feature Engineering and Fraud Detection Algorithms. The Feature Engineering building block examines and analyses the events collected from remote banking channel and create latent variables that form a feature matrix that can be processed easily by a neural network. The Fraud Detection Algorithms perform scoring and classification by sequence learning the temporal patterns of the entire customer history.
Feature Engineering
The Feature Engineering building block examines and analyses the events collected from remote banking channel and create latent variables that will form a feature matrix that can be processed easily by an intelligent algorithm such as neural networks. The features are generated through an iterative extraction-selection-validation process. First, a set of features are developed based on the raw data and RFM technique. Then the features are selected based on a set of rules. Finally, the features are analysed and validated by running a set of experiments. The process is repeated, and more features are identified.
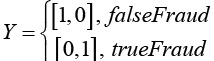
The iterative process is applied to define and represent features of the online payment transactions. Let X={x_1,x_2,…,x_t,…x_n} be the set of all possible events of a customer in remote banking. Mathematically, it is the vector representation set of the information available for n events. Let f be a classifier with its binary range C={trueFraud,falseFraud}, then one can define the payment fraud detection model as a functional mapping, f:X→Y.
If one considers a customer journey on the internet banking site such as customer login, adding a beneficiary or making payment, then the possible events X can be visualised as shown in Figure 2. Each page shown as a circle s representedas a “state” of a customer and each “event” is represented as “state transition” shown as an arrow. The description of the states for an online payment transaction is shown in Table 1.

Figure 2: Customer journey diagram for online banking.
Table 1: Online banking customer journey description.
| State | Description |
|---|---|
| Online Login | Online login page where customer can enter username and password |
| 2nd Factor Authentication (2FA) | A page where customer can carry out 2nd factor authentication to further prove their identity |
| Landing Page | A landing page where customer is shown a list of their active accounts and products |
| View Statement | A page where the customer can view all their statement. |
| View Account Details | A page showing details about the selected account is displayed with top 10 most recent transactions |
| Change Details | A page where customer has an option to select their specific details |
| Change of Telephone | A page where customer can change their telephone number |
| Change of address | A page where customer can change their address |
| Change of password | A page where the customer can change reset their online banking password. |
| Make Payments | A page where customer can make payment to a beneficiary or setup a standing order or direct debit |
| Add new Beneficiary | A page where the customer can add a new beneficiary by inputting beneficiary’s account number and sort code. |
| Existing Beneficiary | A page where customer can make payment to existing beneficiary |
| Confirm payment | A page for customer to confirm the payment |
| Logout | An event via a button to log customer out |
The information describing events in Remote Banking Fraud Detection Framework includes transactional data, personal and account data, and behavioural data. Transactional data captures key attributes of a customer transaction that defines their characteristics and generally stored in Online Transaction Processing (OLTP) relational databases. This includes monetary events (i.e. Account Bill Pay) as well as service events (i.e. change of address). When applied to the fraud domain, this type of data can be used in the setting of RFM where data can be aggregated in accordance with a various time dimension [27,28]. Transaction data can be augmented by personal and account data for better fraud detection. For instance, it shows that several factors such as age, gender and income contribute to people committing fraud [29]. Behavioural data is defined as information that provides context into individual’s behaviour. When it is referenced in the context of fraud detection on bank’s channel, this will include data collected on the customer side as well as on the bank’s side. For example, for online banking data collected on the customer side may include mouse movements and keystrokes. The bank side data may include page navigation, time spent on a page, etc. [28].
The input data have a different range of values and types. These ranges could vary widely, which may impact the model performance. Data normalisation is then carried out by fine-tuning the input variables to bring the entire probability distribution values into alignment. Different data normalisation techniques such as shifting and scaling can be applied to eliminate the effects of certain gross influences.
The data model component is intended to provide a unified view of the data used for PFDS, which can be described either by object-oriented approach, ontology approach or traditional approaches. In our scenario, four data structures to model the states, events, page navigations, customers and remote banking transactions are identified and developed based on object-oriented approach. A detailed class diagram representation of the data model is depicted in section 4 and attached in Appendix 1. Feature set generation is a process of selecting a set of features that are relevant for the model to perform better. The technique of RFM is used to create non-normalised data that can be used to facilitate further analysis. According to the data model, there are different data types associated with different attributes such as numeric, categorical, nominal. Page and transition times are numeric whereas page id is a categorical value. One hot encoding [29] is applied for categorical values by listing down all the different states or web pages of a transaction.
Fraud Detection Algorithms
Here we introduce two fraud detection algorithms in the proposed conceptual framework, i.e., Recurrent Neural Networks and Support Vector Machine, to perform scoring and classification by sequence learning the temporal patterns of the entire customer history.
Recurrent neural networks (RNN): Recurrent Neural Network can efficiently deal with temporal dependencies of the sequence classification problem which can be used for dealing with events from internet banking that is part of an internet banking session. The Universal Approximation Theorem for Recurrent Neural Network highlights that in the case of multiple hidden units it can arbitrarily map the input sequences to output sequences with reasonable accuracy [25]. The usefulness of this theorem is shown in the following examples in Figure 3, which highlight how RNN can be modelled conceptually to map the input sequences and to perform fraud detection.

Figure 3: Examples of non-fraud and fraud customer transaction journeys.
For normal customer behaviours, one may measure the information of the event, time spent at the event and latency introduced while moving from one event to another. The Example 1 here depicts a user navigating from one page to another on the bank’s online portal. For example, the time taken for a user to log into a bank and navigate to Account Overview is approximately 25 seconds. Subsequently, the user navigates from Account Overview page to Make Payment page in approximately 5 seconds and so on. The Example 2 depicts a malware journey for online banking, where malware logins and subsequently go through the same events as normal user in quick succession. Time spent on each event and in-between event here is minimum. A non-repudiation attack is when only the making payment event is observed as depicted in Example 3. This is also known as the “man in the middle attack” where an attacker captures the event and replays over after a while.
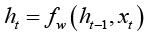
Let X={x_1,x_2,…,x_t,…x_n} be the vector representation set of the information available for n events of a customer in remote banking, where the event label t corresponds to the time t. Let us assume that the feature vector size of each event x_t is m, the input X=(R^m) are drawn from a distribution D, and the output space Y=C^n be the sequences of C={trueFraud,falseFraud}. The objective is then to use X to train fraud detection algorithm f:X→Y to label outputs in a test set X^' ⊆ D in a way that minimises a defined error measure. Here, the representation of the typical Recurrent Neural Networks (RNN) which calculates such a function is shown in Figure 4.

Figure 4: Recurrent neural networks logical architecture.
The RNN architecture is similar to Neural Network architecture but weights are shared across evolving time stamp. As shown in Figure 4, RNN consists of an input layer that contains event at discrete time stamp (ts), a memory or hidden layer and an output layer. The number of input nodes is created based on the number of features in a feature set (x), the number of hidden nodes is created based on trial and error and the output is a single node (y). For online banking, the time-series of input feature vectors in matrix is shown here,
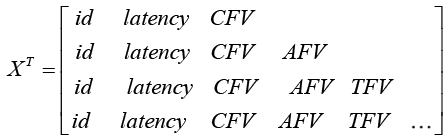 (1)
(1)
where id refers to a transition state such as login page, view bank statements page, make payment to new beneficiary page and change details page, latency is the time difference between page navigation, Context Feature Vector (CFV) includes IP address and malware flag etc., Authentication Feature Vector (AFV) include authentication type etc., Transaction Feature Vector (TFV) include transactional data such as transaction amount, transaction type and beneficiary account number etc.
The current state (t) of the hidden nodes depends on the objective function [30] that takes in the previous state (t-1) of the hidden nodes and the input vector at time t, as shown below,
 (2)
(2)
where h_t is the new state, h_(t-1) is the previous state, x_t is the input vector at time t. This provides a feedback into the network and can be considered as introducing memory to the network. Since the network can hold memory it can be better utilised for classification and prediction tasks, when compared to other neural networks. Several research studies [30-32] showed that hyperbolic tangent have been widely used as an objective function. For the hidden layer of RNN above, one may rewrite the equation 2 as follows,
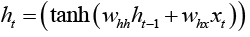 (3)
(3)
where w_hh and w_hx are the weights between the previous state and current hidden nodes, and between input nodes and hidden nodes respectively. Tanh is a logistic function that is non-linear and continuously differentiable. This enables the study of the properties of neural networks for developing learning algorithms. The values of the output layer y(t) are predicted based on the current input, weighted by the coefficients wi of all the past input. The aim of the learning algorithm is to minimise the error by incrementally adjusting the parameters of the algorithm to optimise the objective function h_t during training. The prediction error, e(t), is,
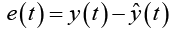 (4)
(4)
For regression models, typically the mean squared error or squared Euclidean distances, i.e.,  is used, where the error is assumed to be statistically independent [30].
The classifier outputs 1 (i.e. trueFraud) if the fraud is detected or 0 otherwise (i.e., falseFraud). A probabilistic classification approach is preferred to calculate conditional probabilities P(y|x). This allows the probabilities to be retained in a consistent manner. The classifier accepts xt and produces a probability score that belongs to the class C as defined previously. The output is based on the SoftMax function which outputs a cross-entropy loss by the equation as follows,
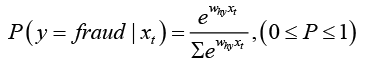 (5)
(5)
The output of the above equation outlines the probability of the event. If the probability is above a defined threshold the system will output 1 as fraud or 0 otherwise.
Long short-term memory (LSTM): For RNN to learn the sequences of events and classify them accurately, an error needs to be calculated and propagated back through the network using the gradient decent algorithm known as Back Propagation Through Time (BPTT) [31]. The advantage of using BPTT is that linear and nonlinear constraints between the shared weights can be easily incorporated. It will allow the model to generalise well to temporal dependencies of different states. For examples, let’s say we started off satisfying the constraint of h_1= h_2, and one needs Δh_1= Δh_2. We can compute δE/(δh_1 )+δE/(δh_2 ) based on the model and error term for h_1 and h_2.
Based on the above, one may build the forward pass that determines user state at each timestamp and followed by a backward pass by computing the error derivatives at each time stamp. The derivatives are added together for all of the timestamps for each weight and then all the copies of the weight are updated by the same amount which is proportional to the sum of those derivatives.
Unfortunately the above algorithm fails to learn where there are long-time lags between the input events and their associated errors flowing back through time or when the network grows from t to t+n [25,31]. As discussed in the paper [31], the error derivatives of the hidden layer consist of Jacobin maps. These maps consist of Eigenvalues, which when goes through differential equations resulting in values converging to zero when values are less than one. This is called vanishing gradient problem. However, if the values are greater than zero, they are pushing away from optimal minimum resulting in exploding gradient. The issues of exploding and vanishing gradients are addressed by the so-called Long Short Term Memory (LSTM) RNN model [32].
The LSTM network is used alongside hidden layer or as a hidden layer to overcome the vanishing and exploding gradient problem. The properties of the LSTM memory block are outlined as depicted in Figure 5.

Figure 5: Long Short-Term Memory (LSTM).
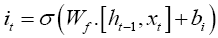
The architecture of LSTMs is comprised of three gates, i.e., input, forget and output gates. The purpose of the input gate is to control the input to a memory cell. Its core function is to allow data into the memory cell and to protect the memory cell from noise. An output gate controls the output flow of cell activations into the rest of the network. The purpose of the forget gate is to forget the memory that has been acquired during earlier time stamp as the content becomes irrelevant.
The first step of LSTM is to update the forget gate that decides which information to remember and forget from the cell state [33]. The equation for the forget gate is given by,
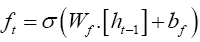 (6)
(6)
The second step is to update the cell state. First, a sigmoid layer decides which values of the state cell to update and then a hyperbolic tan (tanh) layer creates a vector of new candidate values that can be added to the cell state [33]. The update equation is formulated as follows,
 (7)
(7)
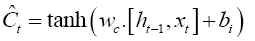 (8)
(8)
The previous cell state (Ct-1) is updated to a new cell state (Ct) by combining equations (4–5). First by multiplying the previous cell state by ft (i.e., forgetting factor) and then add the new candidate values (Ĉt) scaled by it (i.e., the amount of update to each state value).
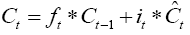 (9)
(9)
The final step of LSTM is to determine the output based on the new cell state and a sigmoid layer,
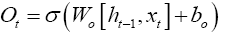 (10)
(10)
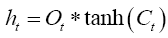 (11)
(11)
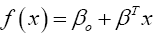
Support Vector Machine (SVM): SVM is a supervised machine learning method that acts a discriminative classifier by a separating hyperplane [34] and outputs an optimal hyperplane when classifying new data given labelled training data. It is a popular machine learning technique used in the fraud detection domain and often ensembled with other machine learning techniques [35-37]. SVMs are useful alternatives to neural networks when the learning objective is a non-convex problem represented as multiple local minima. In such circumstances, neural networks tend to get stuck in an area known as saddle point [38,39]. Another advantage of SVM over neural networks is the large number of hyperparameters that are required to be tuned in neural networks [39] which often slows down the training. A hyperplane is defined by the following function [34],
 (12)
(12)
where β is the weight vector and βo is the bias. The optimal hyperplane can be determined using the following equation,
 (13)
(13)
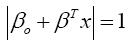
where x represents the closest training dataset to the hyperplane. This training dataset is called support vectors. The distance between a point x and a hyperplane (β, βo) is given by,
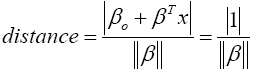 (14)
(14)
The objective of the SVM algorithm is to find an optimal separating hyperplane that maximises the margin of the training dataset [39]. The maximum margin, for an optimal hyperplane, is given by,
 (15)
(15)
Finally, the problem of maximizing M is equivalent to the problem of minimizing a function L(β),
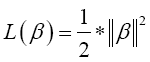 (16)
(16)
Subject to constraints [34],
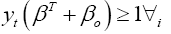 (17)
(17)
where yi is the label of each training data. The constraints model the requirement for the hyperplane to classify correctly all the training examples xi.
The above minimization problem is a problem of Lagrangian optimization that can be solved using Lagrange multipliers to obtain the weight vector β and the bias βo of the optimal hyperplane [34].
General Data Preprocessing and Feature Engineering
A dataset over 100,000 transactions is provided by a European bank for PFDS analysis. The dataset focuses on the online payment transaction which includes four web pages including Login, Second Factor Login, Adding Beneficiary, and Making Payment pages. This highly unbalanced dataset fraud labels for 0.172% of all transactions. Then in the study a synthetic dataset which combines real and simulated datasets are developed. The simulation dataset is generated based on real remote banking events using probabilistic generative models on the set of features that are time dependent such as time spent on a page and time taken between the pages. The data sampling is illustrated in detail in the following section.
Subsequently, an object-oriented data model is developed to provide a unified view of the dataset. Four data classes to model the states, events, page navigations, customers and remote banking transactions have been identified, i.e., Web Page, Page Navigation Graph, Customer and Banking Transaction as shown in Appendix 1. Here, Web Page models the different states of a remote banking transaction. It stores information such as page id, page latent time, page label and information about the neighbor web pages and their corresponding transition time and probability. It has operations for adding neighbor pages, retrieving the most likely neighbor and all potential neighbors, retrieving transition probability and time of a neighbor. Page Navigation Graph is a set of related web pages that represent a remote banking transaction such as payment transaction. It stores the starting web page and other related web pages are retrieved traversing the page navigation graph.
For the numeric values such as page duration time and transition time (i.e., latent time), the mean, rescaling and decorrelation techniques are applied so that the input sequence data can be modelled by a function approximator, i.e., Gaussian Mixtures Models (GMM) [27] to provide smoother standard distribution with zero mean and standard deviation as one. The Min/Max Standardising technique [40] to scale the numeric features such as page and transition times is also used. In the datasets, there are different data types associated with different attributes such as numeric, categorical and nominal data types, where page and transition times are numeric whereas page id is categorical. One hot encoding [16] is applied for categorical values by listing down all the different states or web pages of a transaction.
From the proposed conceptual framework for remote banking fraud detection, an online payment transaction is a sequence of states and state transitions. Each web page is a state. The events (e.g., submitting the form or clicking on links to navigate from one web page to another web page) are state transitions. In our case here, a state is defined by dwell time which is the time spent by a customer on a web page and a state transition is represented by flight time which is the time taken to navigate from one state to another. Therefore, a transaction sample that includes four web pages is a sequence of eight time steps represented by either a dwell time feature or flight time feature as shown in Figure 6.

Figure 6: Representation of the payment transaction as a sequence of page states and event transitions.
As the learning task of an LSTM model is to classify a payment transaction sample, X, into trueFraud or falseFraud, each sample is labelled using probabilistic score either as [1, 0] for a falseFraud sample or [0, 1] for trueFraud as shown below,

 (18)
(18)
Where Y is the class label of sample, DTi is the dwell time or time spent on page i, FTi is the flight time or transition time from page i-1 to page i.
Data Sampling
To overcome the lack of large dataset, a sampling technique based on the Gaussian Mixture Model has been applied. Mixture models support unsupervised methods by applying the Expectation Maximisation Algorithm (EM) to adjust component distributions, which is typically Gaussians [39]. The EM-algorithm is derived from Maximum Likelihood Estimation (MLE) given by,
 (19)
(19)
where x_j is the training data and θ_jis individual Gaussian components. The use of the product rule is to ensure that conditional probabilities are uncorrelated. EM is then given by,
 (20)
(20)
A typical application of the Gaussian Mixture Model (GMM) is to approximate probability distributions from sample data, with the resolution being set by the number of components (Gaussians) being fitted along with a variance regularizer. Each data point is treated as a component with independent mean and variance [41]. By sampling the model’s output represented as probability distribution function of real user’s data, the simulated transactional dataset samples are generated as shown in Figure 7.

Figure 7: Example samples generated based on Gaussian Mixture Model.
The blue points represent original data and the red points represent generated data produced through random sampling. The contours are drawn to highlight the learnt probability distribution from the probability distribution function at different level (i.e. 0.001, 0.01, 0.02, 0.5). This technique resulted in generation of 500,000 transactions that was representative of 80% of legitimate transactions and 20% of fraudulent transactions.
To compare the classification performance of LSTM and SVM, we developed three data scenarios by varying the size and non-linearity complexity of the generated datasets. The non-linearity complexity of the generated dataset is controlled by two parameters, i.e., starting point (b1) and width (b2) of a truncated normal distribution. Three different combinations of b1 and b2 are used to set up the three scenarios. In each group of the modelling, the size of the sample varies from 20,000 to 500,000. An example of the generated datasets is shown in Figure 8 below.

Figure 8: Example demonstration of dataset generated.
In the above graph, a red dot represents the real user journeys in terms of time spent on a page and time spent on navigating to a different page. The green dots represents synthetic data derived based on GMM. The sample ratio of fraud to non-fraud and test to train ratio may vary for the three groups. The method gives a well coverage of datapoints centered at the mean as well as outliers.
Model Implementation and Results
The models are developed based on LSTM and SVM techniques for detecting fraud. And subsequently, their performance is analyzed and compared. In practice, Python with Google’s Tensor Flow library is used to build the PFDS. The pseudocode of the algorithm for implementing LSTM model for detecting fraud remote banking transactions is shown below. The corresponding flowchart outlining the general flow of the implementation is given in the Appendix 2.
1. Generate dataset.
2. Set number of time steps and features.
3. Reshape dataset into three-dimensional tensor (samples, number of time steps, number of features).
4. Split dataset into train, validation, and testing.
5. Set learning parameters (memory size, learning rate, batch size and epochs).
6. Define tensor placeholders for input and output of LSM model.
7. Define LSTM cell.
8. Define tensor variables for weight and bias vectors.
9. Compute the output based on softmax activation function.
10. Define cross entropy loss function.
11. Add Adam optimization function that minimizes the cross-entropy loss function.
12. Set counter to zero and epochs to a maximum number of epochs.
13. Repeat:
1. Compute training error.
2. Compute validation error.
3. Update weights and biases using back propagation.
14. While epochs are less than maximum.
15. Predict for testing dataset using trained LSTM.
16. Produce confusion matrix and F1 score.
A grid search technique is used to find optimal parameters of SVM models. In the case of LSTM, parameters are tuned manually to determine the optimal parameter values. The learning parameters for LSTM and SVM are shown in Tables 2 and 3 below,
Table 2: Learning parameters of LSTM.
| Parameter Name | Value |
|---|---|
| LSTM memory size | [16, 64] |
| Learning rate | [0.001, 0.009] |
| Loss function | Cross Entropy |
| Optimiser | Adam Optimiser |
| Number of features | 8 |
| Feature size | 1 |
Table 3: Learning parameters of SVM.
| Parameter Name | Value |
|---|---|
| Kernel | Radial Basis Function (RBF) |
| Gamma coefficient | [0.1, 0.001, 0.001] |
| Degree | 3 |
| C | [1, 10, 100] |
| K-fold cross validation | 5 |
Figure 9 below shows the training and validation errors for the three data scenarios based on LSTM model. Each data scenario is repeated multiple times and the overall average values are taken. The figure shows that the training error decreases as the number of epochs increases and reaches a minimum error close to zero when epoch number is close to 100. The validation error also decreases on average as the number of epochs increases until the training stops which show that the overfitting does not occur. Figure 10 shows the average training and validation scores of SVM model. The figure demonstrates that both the training score and cross-validation score increase when the training dataset increases.

Figure 9: Average training and validation errors of LSTM model.

Figure 10: Average training and validation scores of SVM model.
There are various tests to evaluate the ability of the proposed methods to achieve desired goals. In this paper, Overall Accuracy (OA), False Acceptance Rate (FAR) and False Rejection Rate (FRR) are used. The FAR measures the likelihood that the framework incorrectly classifies the fraud events as the legitimate events, while the FRR measures the likelihood that the framework incorrectly classifies the legitimate events as the fraud events. For an effective PFDS, the two rates need to be as low as possible. The tables below provide FAR and FRR for the three different scenarios. For the first two scenarios as shown in Tables 4 and 5 respectively, the LSTM has a better FAR than SVM whereas SVM has a better FRR than LSTM. This could be a result of an overfitting problem due to limited real-life dataset. Therefore, further tuning of the LSTM hyperparameters such as memory size and sample size is required. In Table 6 the OA of LSTM model is slightly better than the SVM model, while the LSTM model performs better than the SVM model in terms of FAR.
Table 4: Overall Accuracy, FAR and FRR for Scenario One.
| LSTM | SVM | |
|---|---|---|
| Overall Accuracy | 91.42 | 94.28 |
| FAR | 13.63 | 15.0 |
| FRR | 6.25 | 2.0 |
Table 5: Accuracy, FAR and FRR for Scenario Two.
| LSTM | SVM | |
|---|---|---|
| Overall Accuracy | 97.85 | 97.85 |
| FAR | 2.70 | 4.0 |
| FRR | 1.94 | 1.09 |
Table 6: Accuracy, FAR and FRR for Scenario Three.
| LSTM | SVM | |
|---|---|---|
| Overall Accuracy | 99.28 | 98.57 |
| FAR | 2.85 | 4.76 |
| FRR | 0.0 | 0.0 |
The summary of mean and standard deviation of all three scenario runs are presented in Table 7 below. Overall, the LSTM model performs better than the SVM model in terms of F1 score. The mean and standard deviation of F1 scores across all runs for LSTM model are 0.944 and 0.019 respectively. In the case of SVM, the mean is 0.896 and the standard deviation is 0.031.
Table 7: The Summary result of all experiments.
| Experiment | No of Runs | F1 Score SVM | F1 Score LSTM |
|---|---|---|---|
| 1 | 7 | 0.916 | 0.956 |
| 2 | 7 | 0.893 | 0.926 |
| 3 | 7 | 0.878 | 0.950 |
| Mean | 0.896 | 0.944 | |
| Std. | 0.031 | 0.019 | |
In addition, in order to explore the statistical relationship between the Transition Time and Flight Time, several random users’ events are extracted and analysed. The study on the datasets shows that a customer journey defined as a sequence of events incurs a greater number of events for fraudsters than legit users, in which some are fraudulent.
The sophistication of the fraud Modus Operandi (MO) requires us to rethink on the PFDS approaches. Meanwhile, LSTM is not utilized in remote banking fraud detection. In this paper, a novel fraud detection framework is developed for real time fraud detection. It is capable of automated training and tuning of the models based on thresholds with high F1 scores and novel analytics using LSTM-based Recurrent Neural Networks to uncover suspicious activities on the retail banking channel.
In a real-life scenario study based on the framework, the LSTM models are evaluated against SVM models. The results demonstrate that overall the LSTM models perform better than the SVM models. This is evidenced in the mean and standard deviation of F1 scores across three experiments with different settings. The mean and standard deviation of F1 scores for LSTM are 0.944 and 0.019 respectively whereas the mean and standard deviation of the F1 score for SVM are 0.896 and 0.031 respectively. The findings also support the hypothesis that fraud sequences are generally longer, and time spent on pages by fraudsters are generally shorter. The scenario significantly reduces the amount of the time required for Feature Engineering based on two key features of the raw data, namely, the page time and transition time.
The conceptual framework provided in this paper helps in the aid of detecting complex fraud MOs (Modus Operandi). Applying the LSTM ensures that the notion of self-learning is applied as the payment patterns and user behaviors change over time and hence helps reduce true positive rate and false negative rate. The RNN shows the natural fit for the issue as the study demonstrates that it can efficiently deal with the temporal dependencies of the sequence classification problem which can be used for dealing with events from internet banking as part of an internet banking session. Overall this paper demonstrates that sequence learners such as LSTM can capture temporal dependencies which can be used for detecting fraudulent payment transactions based on events from remote or digital banking. The outcome of the proposed research will have a significant impact on advancing the field of payment fraud detection.
Although our preliminary experiments show the LSTM sequence learner is good to address real time fraud detection, a more complete and systematic framework involving richer algorithms remains to be developed and implemented. In addition, more contextual data around user behaviour and user devices and cross channel transactions to catch further novel features through Feature Engineering are required.
Copyright © 2026 Research and Reviews, All Rights Reserved