ISSN: 1204-5357
ISSN: 1204-5357
Institute of Management Sciences, Peshawar, Pakistan
ATTAULLAH SHAH
Institute of Management Sciences, Peshawar, Pakistan
Visit for more related articles at Journal of Internet Banking and Commerce
This study measures profitability of momentum strategies in Pakistan Stock Exchange. Further, this study compares the profitability of two price momentum strategies i.e. Jegadeesh and TitmanâÃÂÃÂs winner-loser momentum strategy and Georg and Hwang 52-week high momentum strategy. Also, the study investigates the relationship momentum strategies and investor sentiment. Monthly stock prices data of all listed companies is used over the period of January 2002 to December 2015. The analysis showed that Hwang and George, 52-week high momentum strategy have higher returns as compared to Jegadeesh and Titman, momentum strategy. Further, the results showed that the investor sentiment can explain variations in momentum time-varying patterns because the 52-WH has a positive and significant relationship with investor sentiment. Momentum strategy provides a positive significant return in periods of investor optimism while the return decreases in periods of investor pessimism. The current study supports the hypothesis of the George and Hwang, that the investorâÃÂÃÂs decisions are affected by behavioral biases. Results further indicate that using investorâÃÂÃÂs sentiment; an investor can easily predict variation in stock prices occurred in the basis of changes in monetary policy, legislation, business cycles and market status.
Momentum Strategy; 52-Week High Momentum; Investor Sentiment; Business Cycles; Financial Factors
A prominent opinion observed by economists, journalist and physiologist is that individuals normally overreact or show more response to the new information they receive. This overreaction causes the stock market to behave abnormally [1-3]. An extended view on this overreaction of the investor is provided by De Bondt and Thaler [4]. They suggested that stock prices show overreaction to the new information. De Bondt and Thaler [4] also observed that stocks having a holding period of 3 to 5 years perform poorly over the last three to five year but would perform better in coming period as compared to the stock that performed batter in the last 3 to 5 years. However, the results of De Bondt and Thaler [4] research are debatable and require further consideration. The opinions of several researchers are that interpretation of De Bondt and Thaler results may be explained by contrarian portfolio, size effect and systematic risk factors. Further, the long-term winner underperforms long term loser only in the month of January so it may be ambiguous to attribute their result to overreaction.
Most of the researchers have worked on momentum strategy but the two prominent researchers are Lehmann [5] and Jegadeesh [6]. They provided stronger evidence related to a reversal of return in short time period. Such studies suggest that contrarian strategy of stock selection base upon their profitability in the previous days which leads higher return. Whereas the dependence of these strategies are on intensiveness of transaction and are also based on price moment in the short term period, the apparent return may show the pressure of short-term price or low level of liquidity in the market as compared to overreaction. Another study conducted by Jegadeesh and Titman [1] shows a relationship between bad ask spread in shortterm return reversal. In addition to this, Lo and MacKinlay [7] provided a contradictory statement that the major amount of the abnormal return observed by Lemon and Jegadeesh is related to the delayed reaction to stock prices rather than overreaction.
In the recent literature, momentum strategies have attracted a lot of attention because that strategy seems to generate an abnormal return. Many areas regarding momentum have been thoroughly investigated such as foreign currency markets [8] financial markets and commodity trading market [9]. These studies suggested that momentum strategy leads to positive returns during 1993-2000. One of the prominent momentum strategy developed by Georg and Hwang's is the 52 weeks high momentum strategy. The 52 weeks high momentum strategy is to divide the current price of a security by the highest price of that security in the last 52 weeks. According to Georg and Hwang, investors buy a stock having price closer to 52 weeks' highest price and sell a stock having the price far away from it. The 52-week strategy has more significant returns as compared to other momentum strategies and has a dominant role in the equity market [10]. The reason for the high return of that strategy is the investors’ behavioral and anchoring bias and their valuation bias regarding information [11].
The second objective explored by Stambaugh et al. [12] is to develop an understanding of changing time pattern of momentum return in the stock market. This argument is further supported by Hao et al. [10], during high sentiment period there is a probability of high behavioral biases by the investors which influence the stock market either in an upward or downward direction. If the behavioral biases of the investor are positive so they can invest in bulk which will force the market to move in upward direction. Contrary to this if the behavioral biases of the investor are negative so they will withdraw their investment from the market. As a result, the market will move in a downward direction. This is all caused by the investor sentiment [13]. Moreover, the behavioral finance can better explain the emotional aspects of investor decision-making process. Human's sentiments have significant roles in determining the prices of stock than economic and financial factors [14].
In the Pakistan stock exchange there are few evidences that the momentum strategies generate abnormal returns. Additionally, investors slowly and partially adjust to new information in order to display their adjustment and anchoring behavior. Furthermore, the contrarian strategy hypothesizes that future winner is the past loser and it will generate an abnormal return. However, investor overreaction to information can base on a positive significant result of contrarian strategy.
This study investigates these issues over the periods of 2002 to 2015 in the context of Pakistan Stock Exchange (PSX) which is the largest stock exchange in the country and has an excellent trading history and unique characteristics. The study investigates the profitability of two price momentum strategies in PSX i.e. Jegadeesh Titman and Georg and Hwang's 52-week high momentum strategy and tries to find a relationship between these strategies and investor sentiment. Secondly, a link can be established between momentum returns and investors sentiments by using Waugler and Barker [15] index in Pakistan because this index can fairly reflect the investment sentiment. The study is anticipated to have significant practical application and implications for risk management, general portfolio investment decision and could influence decision-making behavior in PSX of investor and assets valuation.
There are two well-known stock momentum strategies: The Jegadeesh and Titman [1] price momentum strategy and the George and Hwang’s [2] 52-week high momentum strategy. The former has been studied by many researchers in Pakistan while the later did not receive any attention. Further, the comparison of both the strategies and the impact investor sentiment on momentum strategy are yet to be studied in Pakistani context. In view this research gap, this study is expected to have significant implications and practical application for risk management, general portfolio investment decision and may influence decision-making behavior in PSX of investor and asset valuation by filling the identified gap.
The study has significant practical application and implications for portfolio performance and investment decision. For example, momentum strategy is like a system which sells stocks that have poor previous return while buying stocks that have a higher previous return within three to twelve months holding period. Financial analysts and fund’s managers use these strategies for their investment decision. Investors might benefit from using 52-week or JT momentum strategy to earn positive returns. Moreover, a portfolio manager might be able to predict the future price of a security using these two strategies.
The main contribution of this research is the assessment of two momentum strategies i.e. Jegadeesh and Titman [1] and George and Hwang’s [2] 52-week high momentum strategy in the context of an emerging economy, i.e. Pakistan. Such comparisons have not been made in the past in Pakistan equity market. Secondly, a link can be established between momentum returns and investors sentiments by using Barker and Waugler [15] index in Pakistan.
This study is divided into five chapters. Background of the study is presented in the first chapter. The second chapter discusses the literature review which explains the review of the investor's sentiment's and momentum. The third chapter discusses methodology which includes the data collection methods, philosophies, constructions of momentum strategies and investors sentiments. The fourth chapter presents and discusses the results and the last chapter concludes this research.
In recent years most of the researchers have focused on the stock market anomalies and have worked upon the behavior of the stock market prices. This analysis tries to predict the profitability and behavior of the stock prices on the basis of previous data. Investors use different investment strategies to generate an abnormal return. The most prominent strategies of them are Jegadeesh and Titman [1] and George and Hwang [2] 52-week high momentum strategy. The price momentum strategy suggests buying past winner stocks and selling past loser stock. If a security performs well in one period, it tends to perform better in the subsequent periods. On the other hand the Georg and Hwang’s 52-week strategy, investors will buy a stock whose price is closer to 52 weeks’ highest price and sell a stock whose price is far from it. Different research studies on this topic covered a period of almost 1985- 2016. The first ever research on this topic was cited in 1985. All the concerns regarding previous studies were the time span of data, research limitations and the difference in market context.
Momentum and Contrarian Strategies
Most studies that have analyzed stocks markets, have reported profits based on contrarian and momentum investment strategies. Momentum and contrarian strategies are simple and short-horizon focused. They are based on a historical pattern of stock prices to generate an abnormal return and predict future stock performance [16]. The first research has been conducted by De Bondt and Thaler [4] on this topic and presented evidence regarding profits based on contrarian strategy in US stock market. The objective of this momentum strategy is to generate an excess return on the extension of the existing trend and move stock price toward trend. Investors buy stocks which have good historical performance and sell past worse performed stocks [6]. They believe that stocks which have good performance will continue the same performance in future as well and vice-versa. On the other hand, contrarian investment strategy is totally opposite in nature to momentum strategy. It suggests that if a stock price has good performance in past such as past winner so it will perform worse in future. Therefore investors buy past loser stock and sell past winner stock [17].
Momentum Strategy
Another tremendous achievement with regard to momentum strategy is that of Jegadeesh and Titman [18]. They compared well-performed stocks with those stocks which performed poorly in past periods. They concluded that momentum return was due to investors over or under-reaction to the new information. They ranked the stocks returns to each firm over the last J months and hold these stocks for K moths (J is formation period and K is holding period 3,6,9 and 12 moths) during 1965-1989. The basis of J months return ranked the stock return in descending order and constructed 10 deciles of the equally weighted portfolio. The top decile is the winner decile portfolio which holds 10% firms and the bottom decile hold lowest 10% firm consider loser portfolio. The strategy takes a long position or buys the winner portfolio and shorts sell the loser portfolio especially zero cost over the K months. The Jegadeesh and Titman [18] strategy consider the J and K month and frequently use the overlapping period such as the K months and then K-1 months, where K is the holding periods while the K-1 is the previous period. According to Jegadeesh and Titman [18] price momentum strategy, buying past winner stocks and sells past loser stock generated high returns. Purchase past having high-value winner stocks while the past loser shares having short premium consider them most consistent and prominent anomalies which are discussed in asset pricing literature.
Georg and Hwang 52-week high Momentum Strategy
The momentum phenomenon arises from anchoring biases [19] and behavioral biases [20]. Based on this phenomenon, Georg and Hwang developed the 52-week high momentum strategy. The 52-week high momentum strategy is to divide the current price of a security by the highest price of that security in the last 52 weeks. According to Georg and Hwang, investors buy a stock that has a price closer to the 52-week highest price and sells a stock that has a price far away from the 52-week highest price. The 52-week strategy has more significant returns compared to other momentum strategies and has a dominant role in the equity market [10]. The main reason behind this phenomenon is investors’ behavioral and anchoring biases and also their valuation bias regard information [11].
Differences between Jegadeesh and Titman and 52-week high Momentum Strategies
The only difference between Jegadeesh and Titman and the 52-week high momentum strategy is the perception of investors and their level of importance that they attach to the new information. The investors who are in favor of Jegadeesh and Titman are of the opinion that a major change in the stock prices is caused by the over- and under-reaction of different investors to new information. Some of the investors overreact to the new information while other underreacts to the new information. So this over and under-reaction moves the stock market either upwards or downward. In contrast, investors who are in favor of the 52-week strategy are of the opinion that new information does not matter and has no effect on the stock market. Due to the anchoring bias of the investors, the only factor that has an impact on stock prices is the current performance of the company when there is a complete absence of new information. Anchoring bias is actually the self attributes of the investors, which is subjective in nature.
Overconfidence and Self-attributes
A rational person takes available information while making his investment decision [21]. Although, the recent literature of psychology shows that investors frequently make an irrational investment decision. The first research on the role of psychology in financial issue has been conducted by Burrell [22]. They presented the Prospect Theory which states that investors consider the potential values of profit and losses in making an investment decision. The investors use different heuristics to evaluate these profits and losses rather than final outcome. However the psychological factors such is anchoring bias, overconfidence and self-attributes strongly affected the investment decision [10]. The reason of anchoring bias is overconfidence of investors. It has a strong effect in creating an anchoring bias i.e. subjectivity of each investor regarding new information. Due to overconfidence, each investor has a strong belief in his/her own idea as compared to the original accuracy of his/her idea in objective terms. The investor tries to perceive subjectively and having a strong influence on his own subjectivism and neglecting objective accuracy. So investors can look at the current situation of the market and try to perceive the future performance of the companies according to their own imagination which leads them to the factor of anchoring bias. Second reason for momentum strategy is the selfattributes of the investors i.e. each investor has his own state of mind, character, personality traits, thinking ability, different family background etc. So they try to perceive the existing situation of the market according to their own self-attributes and try to predict the future performance of stock which causes a major change in stock prices [11]. Each investor tries to impose his/her own imagination and expect the market to behave toward their belief. Therefore self-attributes is another major cause of anchoring bias. These two factors such as anchoring bias and behavioral biases are in favor that changed in stock market cannot due to the new information but investors look at the present situation of market.
Investor Sentiments and Momentum
The second important objective of this study is to understand and observed the timevarying patterns of stock momentum return. This investigation was encouraged by Stambaugh, Yu and Yuan [12] stated that behavioral and anchoring biases arise with investor sentiment because sentimental investor’s capitalize more during high sentimental periods while during low sentiment periods their level and volume of investment decrease. Sentiment investor’s invest on the basis of sentiments only, which creates a problem of anchoring bias. They do not consider fundamental information, economic and financial factors only because they follow a pattern of their emotions [13]. However, the investor sentiment can predict risk phenomena in asset pricing anomalies and the link can exist between momentum return and investor sentiment [23]. Moreover, this question is still unanswered and needs to be resolved about how significantly or insignificantly the momentum strategies are affected by investor sentiment.
This study hypothesized that if the return of the momentum strategies was affected by investor miss-reaction and irrational behavior toward information, it would also diverge with investor sentiment. However, this study followed the Wurgler and Barker [24] investor sentiment. They discussed the history of the stock market as full of such events that were based on investor sentiments decisions and that caused problems in the whole market.
1. Profitability of Jegadeesh and Titman [18] price momentum strategy is lower than 52-week high momentum because the 52-week high momentum strategy subject to behavioral and anchoring biased. The return continuation arises due to investors’ self-attribute and overconfidence.
2. The 52-week high Momentum Strategy return is higher in optimistic period than a pessimistic period.
The momentum strategy generates a more statistically significant return in the optimistic period and causes a lower return in pessimistic period because investor give more value to the positive information and follows the bullish trend in the optimistic period while gives less value to the new information in bearish trend and pessimistic periods [25].
This study is conducted under the positivist paradigm. According to the literature review and theoretical framework, the positivist philosophy is an appropriate paradigm for this study because it describes the association among variables [26]. The recommended methodology for the study is to use secondary data strategy for the reason that is a systematic way of collecting descriptive quantitative data [27]. The study uses secondary data for the analysis.
Data Collection Tools and Techniques
The study uses monthly stock prices data of all those companies that are listed in Pakistan Stock Exchange (PSX) from the period of January 2002 to December 2015. Data required for construction of sentiment index is collected from State Bank of Pakistan (SBP) and Security and Exchange Commission of Pakistan (SECP). Firms with prices less than Rs.5 are excluded from the analysis.
Data Analysis Techniques
This study calculates momentum returns for both the strategies according to their given methodologies and finds the best strategy. Then, the study investigates the relationship between the best momentum strategy and investor sentiment. The analysis also controls for the lead-lag effect in stock prices. The study uses ASM program of Stata software for the formation and holding period of momentum portfolio, developed by Shah [28] and Gretel for the construction of investor sentiment index.
Constructions of Momentum Strategies
This study measure momentum profitability through different strategies likewise Hwang and George [2] 52-week profitability momentum (52-WHM) and Jegadeesh and Titman [3] momentum (JTM). The study investigates several patterns, including 12-month holding, 12 month testing periods and skipping one month and two months returns to investigate momentum profitability. The previous 12 months cumulative returns are calculated through Jegadeesh and Titman strategy. JTM rank the stock on the basis of cumulative return, the top 30 percent are declared as the winner stocks and the bottom 30 percent as the loser stocks.
The 52-WHM strategy divides current price of a stock on the highest closing price within past 52 weeks, means the highest price in a single year. The stocks are ranked based on:
 (1)
(1)
Pi,t-1 represent the price of stock i at the end of month t-1 and High,t-1 is the highest price of stock i during 52-weeks that ends on the last day of month t-1.
According to the 52-WH find the highest value of a stock and then divide each price of the stock by highest value. The 52-week high price strategy suggests to short selling the stock when the current price of a stock is far from their 52 WH price and buys stock when the current price of a security close to their 52 WH price. The maximum value of the 52-WH is equal to 1 i.e. the price of that security is close to past 52-WH strategy (price of the security is close to the maximum price in a single trading year). The top 30 percent stocks represent winner and bottom 30 percent represent loser stock.
Empirical Method
The study uses Fama and MacBeth, cross-sectional regression to measure momentum profitability of two strategies [2]. The following cross-sectional regression of Fama and Macbeth equation is used to examine the momentum profitability of each strategy.
 (2)
(2)
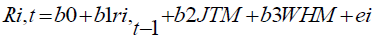
The Ri,t represents the stock return for the month of t, b0 is the intercept of the model, the Ri,t-1 represent the lagged return for each month, JTM represents Jegadeesh and Titman [3] and WHM represents 52-week profitability momentum. To find out risk-adjusted-returns, time series regression is used to hedge out the exposure to risk. The results from two strategies are also simultaneously investigated to check their relative profitability.
 (3)
(3)
The Ri,t is the stock i return for the t time, ri-1 is the lagged return of the i stock for the period of t, JTW is the return of winner stocks and JTL is loser stocks of Jegadeesh and Titman. The WHW show the winner and WHL show loser stocks of 52-WHM. The momentum strategy net return of the Jegadeesh and Titman's and 52WH is calculated through coefficients of the eqn. (3). The net return is b2t-b3t for JT and b4t-b5t for WHM.
Investor Sentiment
The empirical researchers have used different proxies that include (i) sentiment index which is trading, investor's mood and (ii) closed-end fund discount and stock turnover recognized. This study uses proxies of Baker and Wurgler [15,24] for the construction of investor sentiment index. These authors use IPO's first-day return, dividend premium and stock turnover and debt to equity for making investor sentiment index. These proxies have a major role in the decision process of investors [29] and measure both short-run and long-run return [30]. The initial public offerings generate irregular returns i.e. they generate an abnormal return that is difficult to understand might be because of the enthusiasm of investor for making such investment [15]. The return of IPO’s considers the difference between offer price of IPO's and first-day closing price [30]. The turnover is measured as the trading volume for a period of time divided by a a total number of shares. The dividend premium is defined as the dividend per share divided by market price. And the closed discount is the difference between the net value of the asset (NAV) and market price [15]. The proxies which are included in investor sentiment are given below.
DDP=dividend premium=dividend per share/ price
CEMF=close-end mutual funds discounts=net asset value – market price
IPO=total number of IPO's in a year
IPOR=IPO's first-day return
ETD=equity to date ratio
ST=share turnover=number of shares traded/outstanding shares.
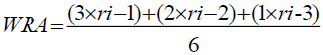
This study identifies the investment periods through Antoniou and Subrahmanyam [13]. Three months weighted rolling average is calculated through investor sentiment data. The 3 weights assigned to the most recent month, 2 to the prior and 1 to the first month of formation period. The following formula is used in the weighted rolling average return.
 (4)
(4)
When weighted rolling average calculated through investor sentiment data then arrange in descending order to find the top 30% and bottom 30% of the sentiment index. If the three-months weighted rolling average ending in month t belongs in the top 30% of the sentiment time series, formation period categorized optimistic period while bottom 30% is considered pessimistic period of the investor sentiment, the rest of the sentiment-classified mild sentiment [31-39].
This study performs overlapping portfolios. In each holding-period month, stocks hold from different formation periods, across which sentiment can differ. In these formation periods, order to calculate the average sentiment. This study first calculates whether each of these formation periods is pessimistic or optimistic as above explained. After that study counts the optimistic and pessimistic in the formation period. The particular holding-period month will categorize optimistic if the formation period is categorized optimistic, if the formation periods pessimistic the particular holding-period months is categorized pessimistic periods. The reaming periods consider months of mild sentiment. To identify the sentiment period the study use three dummy variables which are OPT (optimistic), PET (pessimistic) and MLD (mild). The study uses time series regression with no constant to investigate the relationship between the dummy variables such as optimistic, pessimistic and mild and momentum returns [40-46].
 (5)
(5)
Ri,t shows the momentum return, OPT is the dummy variable of the optimistic period, PET is the dummy variable of the pessimistic period and MLD is the dummy variable of mild period sentiment. The dummy variables are created to investigate the relationship between investor sentiment and momentum return. However, the momentum return associated with investor sentiment and the momentum return arises due to irrational investor miscreation to information [23].
Analysis
This study starts investigation and evaluation by observing whether Jegadeesh and Titman [3] and 52-week high momentum strategies provides significant returns. Table 1 shows average monthly returns of the most successful strategies (2-months holding and 3-month testing periods) and their associated information. Table 1 Panel A report results of post ranking portfolio skipped one month between ranking and holding periods while Panel B reports post ranking portfolio delay one month formation period excludes month of January from January 2002 to December 2015 (All shares which price is greater than Rs,5). Table 2 Panel A to C reports average returns of 52-WHM strategy. Second columns of each Panel, (Tables 1 and 2) show number of observation (Obs). Table 3 Panel A and B reports results of eqn. (3) based on two strategies. The relationship between most prominent strategy 52-WHM and ISI index are reported in Table 4.
Table 1: Jegadeesh and Titman, Momentum Strategy.
| January 2002 to December 2015 | Feb 2002 to Dec 2015 (excluding Jan Months) | |||
|---|---|---|---|---|
| Panel A | Panel B | |||
| Formation-Holding Periods | Obs. | Mean(Ri) | Obs. | Mean(Ri) |
| 156 | .00045 | 128 | .00131 | |
| PSX all stocks excluding small stocks (price <5) | 153 | .00972 | 125 | .00273 |
| 152 | .00961 | 124 | .00903 | |
Table 2: 52-Week High Momentum Strategy.
| January 2002 to December 2015 | Feb 2002 to Dec 2015 (excluding Jan Months) | |||||
|---|---|---|---|---|---|---|
| Panel A | Panel B | Panel C | ||||
| Formation-Holding Periods | Obs. | Mean(Ri) | Obs. | Mean(Ri) | Obs | Mean(Ri) |
| 118 | .00302 | 158 | .00740 | 140 | .00274 | |
| 115 | .00246 | 157 | .00661 | 139 | .00224 | |
| PSX all stocks minus small stock (price <5) | 113 | .00199 | 156 | .00622 | 138 | .00182 |
Average differential return (stock return minus market return).
Table 3: Raw Return.
| January 2002 to December 2015; (Excluding Jan Months) | ||
|---|---|---|
| Panel A | Panel B | |
| Variables | Co-efficient | Co-efficient |
| Intercept | .003035 | .003889 |
| Rt-1 | .006599 | .021739 |
| JWT | .0046043 | .00220962 |
| JLT | .0061668 | -0.00220962 |
| JWML | .00302059 | .00142491 |
| Panel C | Panel D | |
| Variables | .0027011 | .0038898 |
| Intercept | 0.001356 | .1477202 |
| Rt-1 | 0.007108 | .006785 |
| JWT | 0.00992 | .002296 |
| JLT | 009069 | .0035410 |
| JWML | Number of obs=155; F(4,150)=3.65 Prob>F=0.0072 | Number of obs=114; F(3,110)=4.37 Prob>F=0.0060 |
Table 4: Investor sentiment and momentum.
| Variables | coefficient | t-test | Prob |
|---|---|---|---|
| OPT | 0.3258796 | 15.25 | 0 |
| PET | 0.2884033 | 12.78 | 0 |
| MLD | 0.2779192 | 15.37 | 0 |
| Number of obs=118 | R-squared=0.8103 | Adj R-squared=0.8053 |
F(3,115)=163.72 Prob>F=0.0000
Durbin-Watson statistic (original) 0.975117
Durbin-Watson statistic (transformed) 1.712175
Table 1 (Panel A) reports the average profitability of Jegadeesh and Titman (JTM) strategy. The average monthly return of the JTM strategy is 0.045% in the first testing period (the monthly average return of holding periods i.e. one period after the formation), 0.0972% in the second period two months after the formation periods and 0.0961% in the third period three months after formation periods. Panel B reports the average profitability excluding the month of January. The monthly returns are 0.131%, 0.273% and 0.903%. The JTM generate high returns when we exclude the month of January. However, the results suggest that investors are constituent to tax loss selling affect. Investors sell the stocks in the month of December with a capital loss because to reduce capital gain and avoid paying income tax on recently sold assets. The investors repurchase the stocks within 30-days through wash sale. (When an investor sell stocks through a broker and order to realized loss, but at the same time repurchase the same asset from another broker). The shares which sold for capital loss have been in possession of the investor for 30 days. The JTM strategy generates significantly high returns. These results support self-attribution and overconfident hypotheses which state that pattern of momentum return arisen based on investor over-reaction or under reaction to the information. The overreaction and under-reaction arise from investor self-attribute and overconfident phenomena [47-56].
This Table 1, reports the profitability of JTM strategy with 2-month holding and 3- month testing period. The strategy first calculates the return of all securities and then identifies the winner/loser (top 30% stocks are winners and bottom 30% are losers). The ‘Obs’ refers to a number of observation while mean (Ri) is the average return. Companies with share price greater than Rs.4 are included in the analysis. The sample period is from 2002 to 2015.
The Table 2 (Panel A) illustrates the average profitability of the 52-WHM strategy. The returns are 0.302% in firs period, 0.246% in second and 0.199% in the third testing period. The strategy has statistically significant high returns as compared to JT strategy of Table 1. Table 2 (Panel B) reports that the mean returns are 0.74%, 0.661%, and 0.622% excluding the month of January. The average profitability of 52- WHM strategy Panel B has increased due to excludes the month of January. The reason for high returns is tax selling effect. The results suggest that investors realize losses to take advantage of tax shields by selling lesser stocks at the year end and repurchasing them back in the month of January [2]. However, the momentum return is lower in the month of January as compared to other months because of the pessimistic period. Investors believe that price of shares increase in the month of January due to investors repurchasing of the stocks which sell in December for taking tax selling effect advantage [10]. Therefore January month also can carry seasonality effects along with momentum returns. Panel C shows a differential return (Ri). The average profitability's for the first, second and third periods are 0.274%, 0.224%, and 0.182% respectively when subtracting market return. Obviously, the 52 WHM strategies generate more return as compared to KSE-100 Index. Further, the results show that 52- WHM strategy yield higher returns than JTM strategy [57-61].
Portfolio managers can use 52-WHM strategy by buying stocks whose prices are close to 52-week highs and sell those whose prices are away from the 52 Week high prices. The logic of 52-WHM is based on anchoring and behavioral biases.
This Table 2, reports the profitability of 52-WHM strategy with 2-month holding and 3-month testing period. The stocks are ranked on the basis of eqn. (1) and then calculated the returns. The stocks are arranged on the basis of highest returns in each month and then identify the winner/loser stocks The ‘Obs’ refers to number of observation while mean (Ri) is the average return. Companies with share price greater than Rs.4 are included in the analysis. The sample period is from 2002 to 2015.
Regression Analysis
Table 3 reports relationship between Ri (Stock returns) and independent variables such as winner returns (WT), loser returns (LT) and winner min loser returns (WML) of each strategy. The Panel A reports the association of returns generated by Jegadeesh and Titman (JTM) strategy and other explanatory variables. The value of F statistics shows 3.65 (0.0072) for Panel A and C while 4.37 (0.0060) values for Panel B and D. It presents the validity of the model [62-69].
The Jegadeesh and Titman winner returns (JWT) and Jegadeesh and Titman winner minus loser return (JWML) have a statistically significant value of 0.2209% and 0.1424% while the Jegadeesh and Titman loser (JLT) has -0.2209% statistically insignificant value. Panel B reports coefficients of regressions that excludes the month of January. The investors sell loser stocks at the end of the year to taking tax loss selling advantage and repurchase in the initial stage of the year. Therefore, prices of the securities robust in the month of January.
The 52-WHM strategy reports statistically significant values 0.6785%, 0.2296 and 0.3541, it means that if the 52-WHM strategy returns increased 1% the return of the stock will increase by 0.3541%. So the securities return variation on average 0.3541% with 52-WHM strategy. Panel D reports coefficients of regressions that excludes the month of January.
This Table 3 reports regression of stock returns (Ri) on lagged returns (Rt-1), winner returns, loser returns, and winner minus loser returns for each strategy. The strategies used 2-month holding and 3-month testing period. Companies with share price greater than Rs.5 are included in the analysis. The sample period is from 2002 to 2015.
The Table 4 reports time series regression of 52-WHM strategy returns and investor sentiment index (ISI). The ISI index consists of three dummy variables which are OPT (optimistic), PET (pessimistic) and MLD (mild). The weighted rolling average is used (eqn. (4)) to investigate the dummy variables. The table is based on eqn. (5). The sample period is from 2002 to 2015.
Investor Sentiment and Momentum Return
This study used the Waugler and Barker [24] sentiment index. The principle component analysis is used to calculate investor sentiment index. The investor sentiment has the following equation.
 (6)
(6)
Table 4 reports time-series regression of returns from 52-WHM strategy and investor sentiment index (ISI). The ISI index consists of three dummy variables which are OPT (optimistic), PET (pessimistic) and MLD (mild). The result shows that all variables have statistically significant positive return such as OPT, PET and MLD has 32.5879%, 28.8403%, and 27.7919% values. It means that ISI has a direct relationship with momentum return. The OPT has a higher value as compared to the other dummy variables. It shows that momentum strategy generates a high return in the optimistic periods. The F test has a significant value which reports validity of the model. The adjusted R-square has value 0.80 that means that the independent variables show 80% variation in the dependent variable (momentum return).
The aim of this study is to investigate the profitability of two price momentum strategies i.e. Jegadeesh Titman and Hwang's and Georg 52-week high momentum strategy so results show that these two strategies individually show strong positive returns whereas when the two strategies were compared, the 52-week return was significantly high. The study also finds a positive statistically significant relationship between 52-WHM strategy and investor sentiment index. Our proposed hypotheses i.e. the 52-WHM strategy generates high returns as compared to Jegadeesh and Titman price momentum strategy, and momentum generates a positive return in the optimistic periods are accepted.
The study investigates (i) the profitability of two price momentum strategies i.e. Jegadeesh Titman [18] and Hwang's and Georg 52-WHM strategy (ii) association of price momentum strategies with investor sentiment index. The study finds a statistically significant relationship between these strategies and investor sentiment in the Pakistan Stock Exchange. The analysis indicates that Hwang and George [2] 52-WHM strategy generates high returns as compared to Jegadeesh and Titman [3] price momentum strategy in Pakistan. The study also tests the hypothesis of the Hwang and George [2] that the investors make investment decision through anchoring and behavioral biases.
This study further investigates the relationship between momentum profitability and investors sentiment. The result demonstrates that investor’s sentiments can explain variations in momentum time-varying patterns because the 52-WHM strategy has a positive significant relationship with investor sentiment. The momentum strategy provides positive significant returns in periods of investor optimism while the return decreases in periods of pessimism. This study considers several predictability variables which might affect a security return such as business cycles, market states, and change in monetary policy. The empirical results suggest that the investor’s sentiments play vital roles in predicting the profitability of momentum strategy
This finding has significant practical application and implications for portfolio performance and investment decision. For example, financial analysts and fund’s managers can use these strategies for their investment decision. The momentum strategy also provided an abnormal return on the basis of seasonal effects because the investors try to eliminate the tax loss. Investors might benefit from using 52-WHM strategy and JT price momentum strategy to earn positive returns. However, it is important to note that the study has not considered transaction costs, which future studies can account for. The empirical results also suggest that investors consider investor sentiment when making an investment decision. Further studies can consider consumer confidence index (CCI) instead of sentiment index.
Copyright © 2024 Research and Reviews, All Rights Reserved